


Detailed engineering guide based on ISO 18488:2015 and ISO 18489:2015
Strain Hardening Modulus (SHM) and Cracked Round Bar (CRB) test methods for PE piping materials, pipes, and fittings.
1. Executive Technical Summary
Slow crack growth (SCG) is one of the principal long-term fracture mechanisms relevant to polyethylene piping materials. It is fundamentally different from immediate ductile overload: a pipe or fitting can remain below its short-term yield strength and still experience progressive crack extension from a defect, notch, scratch, inclusion, or highly stressed local region. For this reason, long-term polyethylene performance cannot be assessed from yield stress or short-term tensile strength alone.
ISO 18488:2015 and ISO 18489:2015 provide two complementary ways of characterizing SCG resistance. ISO 18488 determines the strain hardening modulus, <Gp>, from the post-draw tensile response of compression-moulded polyethylene at 80 °C. ISO 18489 uses a circumferentially notched cylindrical specimen and cyclic tensile loading to generate slow crack growth and records the number of cycles to failure as a function of stress range.
The two standards differ in physical approach, specimen geometry, temperature, loading history, and primary output. ISO 18488 is an intrinsic material characterization method based on the molecular deformation response after the natural draw ratio. ISO 18489 is a fracture-based method that deliberately introduces a sharp crack-like notch and evaluates crack propagation under cyclic loading. Used together, they provide a powerful framework for resin screening, material ranking, product evaluation, research and development, and technical comparison of PE pipe grades.
2. Engineering Background: Slow Crack Growth in Polyethylene
Polyethylene used in pressure piping combines crystalline lamellae with amorphous regions containing molecular tie chains and entanglements. Under long-term localized stress, deformation can concentrate near a flaw or crack tip. The material may form fibrillar structures, undergo chain orientation, and progressively lose load-carrying capacity in a narrow process zone. Crack growth can therefore proceed slowly over a long period before final failure.
The introduction to ISO 18488 describes SCG resistance as related to the lifetime of polyethylene products and links strain hardening behavior to the ability of the molecular network, particularly tie molecules, to resist disentanglement. ISO 18489 emphasizes the need for accelerated methods because modern PE grades can exhibit such high resistance to crack initiation and SCG that older methods may require impractically long test periods. The CRB geometry and cyclic loading regime are intended to accelerate the relevant failure process at application-relevant ambient temperature without relying on stress-cracking liquids.
From an engineering perspective, SCG resistance is affected by material formulation and molecular architecture, but measured results are also sensitive to specimen preparation, orientation, residual stresses, notch quality, loading mode, temperature, and data treatment. This is why both standards contain detailed controls on specimen preparation and test execution.
2.1 Ductile failure versus slow-crack-growth failure
Ductile failure is characterized by extensive plastic deformation and gross yielding before rupture. SCG failure, by contrast, is dominated by localized crack advance and typically produces a relatively brittle-looking fracture region. In ISO 18489, this distinction is not merely descriptive: predominantly ductile CRB specimens are excluded from data evaluation because the test is intended to characterize slow crack growth, not ductile overload.
2.2 Why accelerated SCG methods are needed
Modern PE80, PE100, and high-SCG-resistance pipe materials can survive traditional long-duration tests for very long periods. Accelerated tests must therefore shorten the experimental time while preserving a failure mechanism that remains technically meaningful. ISO 18488 accelerates characterization by measuring a deformation property that correlates with SCG behavior. ISO 18489 accelerates crack propagation through controlled specimen geometry and cyclic loading.
3. Relationship Between Molecular Structure, Strain Hardening, and SCG
The strain hardening region occurs after yielding and neck propagation, when the polymer chains in the highly drawn zone become strongly oriented. The resistance of the molecular network to continued deformation produces an increasing true stress with increasing draw ratio. ISO 18488 quantifies this behavior through <Gp>. The informative annex links the strain-hardening response to the underlying entanglement network and describes it using a Neo-Hookean constitutive model.
The CRB method does not directly calculate molecular entanglement density. Instead, it subjects a sharp, controlled crack geometry to cyclic tensile loading. The crack-tip process zone repeatedly experiences stress and deformation, making the number of cycles to failure a direct fracture-based response. Consequently, the tests should not be expected to produce identical rankings in every possible material system, but both are relevant to the broader engineering problem of slow crack growth.
4. Standards Architecture and Normative References
ISO 18488 and ISO 18489 are both test-method standards prepared within ISO/TC 138, SC 5 for plastics piping systems. Each standard defines its own scope, apparatus, specimen preparation, procedure, data treatment, and reporting requirements. Their normative references provide additional requirements for tensile testing, force measurement, extensometry, standard atmospheres, and machining.
| Standard | Normative references explicitly identified | Function in the method |
| ISO 18488:2015 | ISO 527-1; ISO 7500-1; ISO 9513 | Tensile principles; force-system verification; extensometer calibration. |
| ISO 18489:2015 | ISO 291; ISO 2818 | Conditioning/testing atmospheres; machining of plastic specimens. |
5. ISO 18488:2015 – Scope, Principle, and Terminology
5.1 Scope
ISO 18488 specifies a method for determining the strain hardening modulus of polyethylene and uses that modulus as a measure related to resistance to slow crack growth. The modulus is obtained from stress-strain curves measured on compression-moulded samples. The method includes requirements for equipment, precision, sample preparation, test execution, and calculation.
STANDARD REQUIREMENT: The method is intended for polyethylene materials used for pipe and fitting applications and is described as applicable independently of manufacturing technology, comonomer, or catalyst type.
5.2 Principle
Test pieces cut or punched from compression-moulded sheet are tensile-tested at 80 °C. The stress-strain curve must extend sufficiently beyond the natural draw ratio. The strain hardening modulus is then determined from the post-draw region of the true-stress response using the Neo-Hookean treatment specified in the standard.
5.3 Key terms and symbols
| Term | Symbol | Unit / expression | Technical meaning |
| Gauge length | l0 | mm | Initial distance between gauge marks in the central part of the specimen. |
| Thickness | h | mm | Smaller initial dimension of the rectangular cross-section. |
| Width | b | mm | Larger initial dimension of the rectangular cross-section. |
| Test speed | v | mm/min | Rate of separation of the gripping jaws. |
| Length | l | mm | Instantaneous distance between gauge marks. |
| Engineering stress | σ | MPa | Normal force divided by original cross-sectional area. |
| Stress at yield | σy | MPa | Stress corresponding to the strain at yield. |
| True stress | σtrue | MPa | Draw ratio multiplied by engineering stress under the volume-conservation treatment. |
| Strain | ε | dimensionless or % | Increase in length divided by original gauge length. |
| Strain at yield | εy | dimensionless or % | First occurrence of increasing strain without increasing stress. |
| Draw ratio | λ | dimensionless | Current gauge length divided by original gauge length. |
| Strain hardening modulus | <Gp> | MPa | Slope parameter of the Neo-Hookean representation over the prescribed high-draw region. |
6. ISO 18488 – Apparatus and Metrology Requirements
6.1 Tensile-testing machine
STANDARD REQUIREMENT: The tensile-testing machine must comply with ISO 527-1 and be capable of maintaining a test speed of 20 ± 2 mm/min.
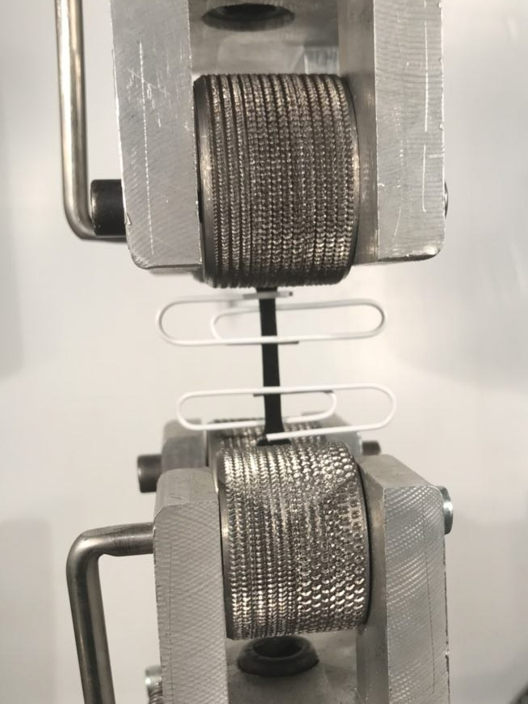
The machine must provide stable large-deformation tensile loading while operating inside or through an 80 °C temperature chamber. Grip design is especially important because the specimen undergoes very large draw ratios and any slippage directly invalidates the strain measurement.
6.2 Load cell
STANDARD REQUIREMENT: The load cell must meet Class 1 as defined in ISO 7500-1.
The standard identifies force ranges that the system must measure accurately: approximately 40 N for 0.30 mm specimens and approximately 120 N for 1.0 mm specimens. The selected load-cell capacity should therefore not be unnecessarily high, because excessive capacity can reduce useful resolution.
6.3 Extensometer
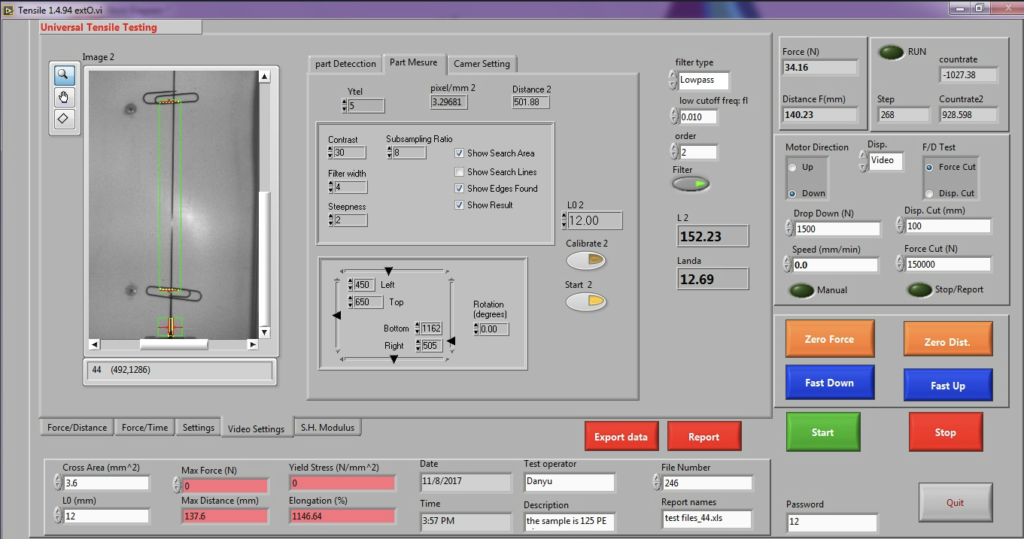
STANDARD REQUIREMENT: The extensometer must comply with Class 1 as defined in ISO 9513. Machine traverse displacement must not be used as the measure of strain.
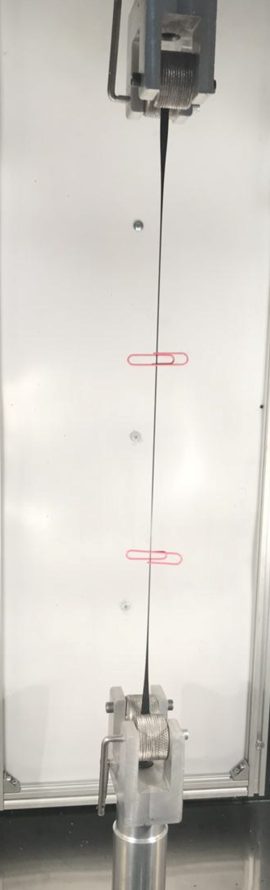
For 0.30 mm specimens, the standard prefers a non-contact extensometer. Optical strain measurement is particularly advantageous because the specimen becomes highly drawn and thin, and mechanical contact can disturb the deformation or lose tracking at large extension.
6.4 Temperature chamber
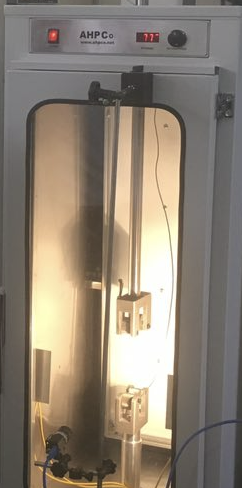
STANDARD REQUIREMENT: The test temperature is 80 ± 1 °C.
The chamber must maintain the specimen and measurement zone within this range. Remote operation of the grips is recommended so the chamber does not need to be opened during the clamping sequence.
6.5 Dimensional measurement
STANDARD REQUIREMENT: Thickness must be measured with a device having 0.005 mm accuracy and a contact dimension smaller than the 4.0 mm parallel specimen width. Width must be measured with 0.01 mm accuracy.
The width measurement should not deform the thin specimen. ISO 18488 recommends microscope measurement as a way to avoid compressing or distorting the specimen during width determination.
6.6 Punch knife
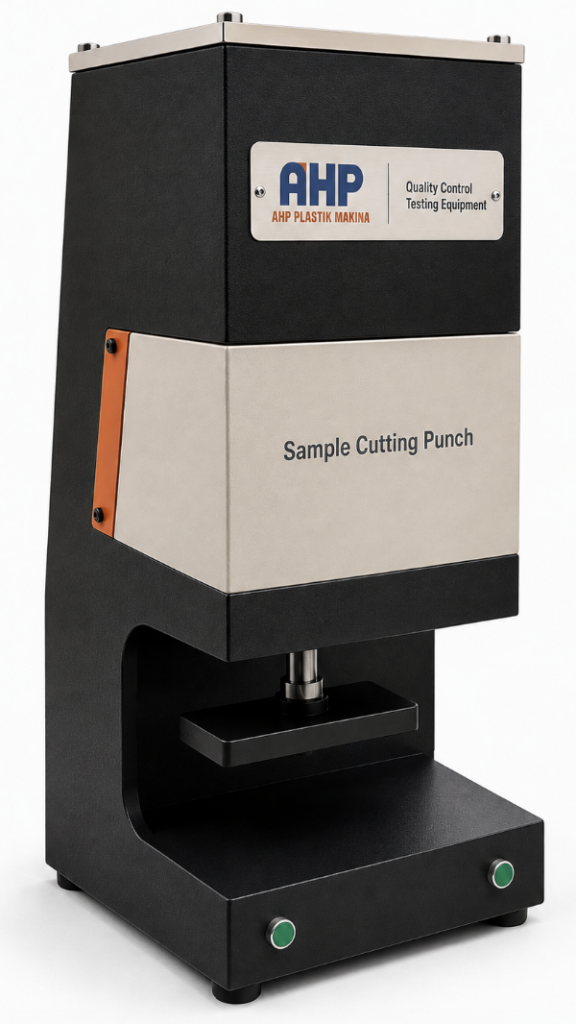
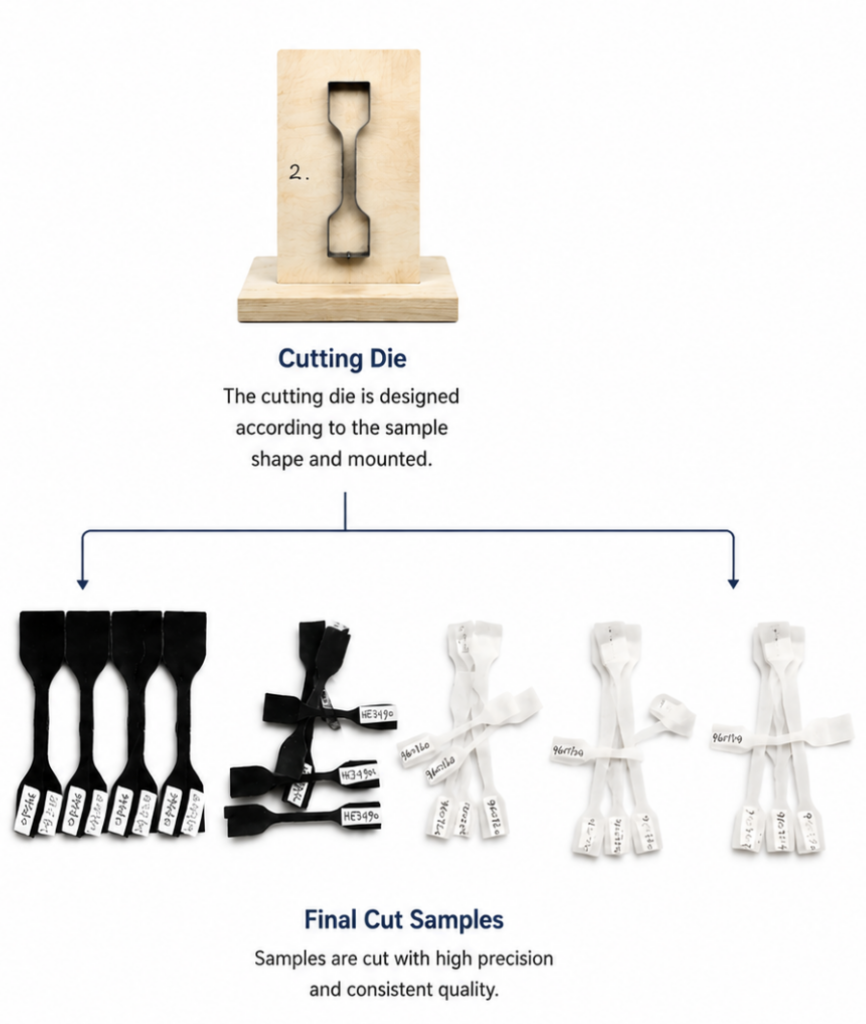
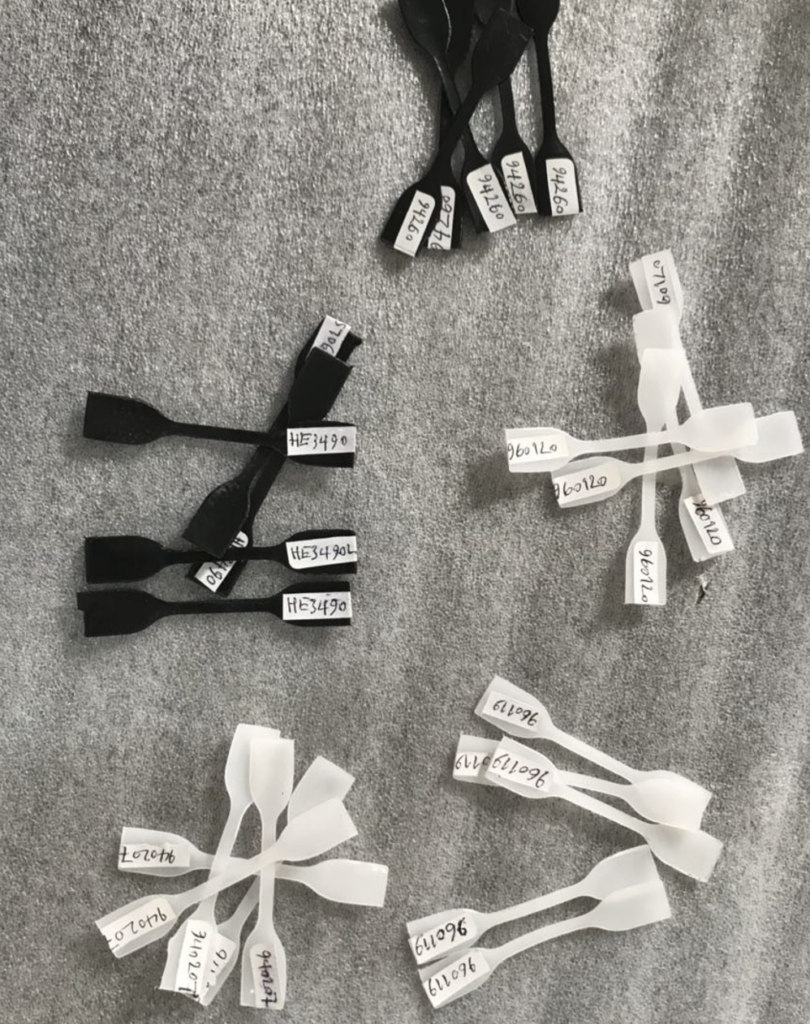
The specimen is prepared using a punch knife matching the geometry defined by the standard. The cutting edge and punching process must preserve smooth, undamaged specimen edges because edge flaws can cause premature failure before the required draw-ratio range is reached.
7. ISO 18488 – Specimen Geometry and Preparation
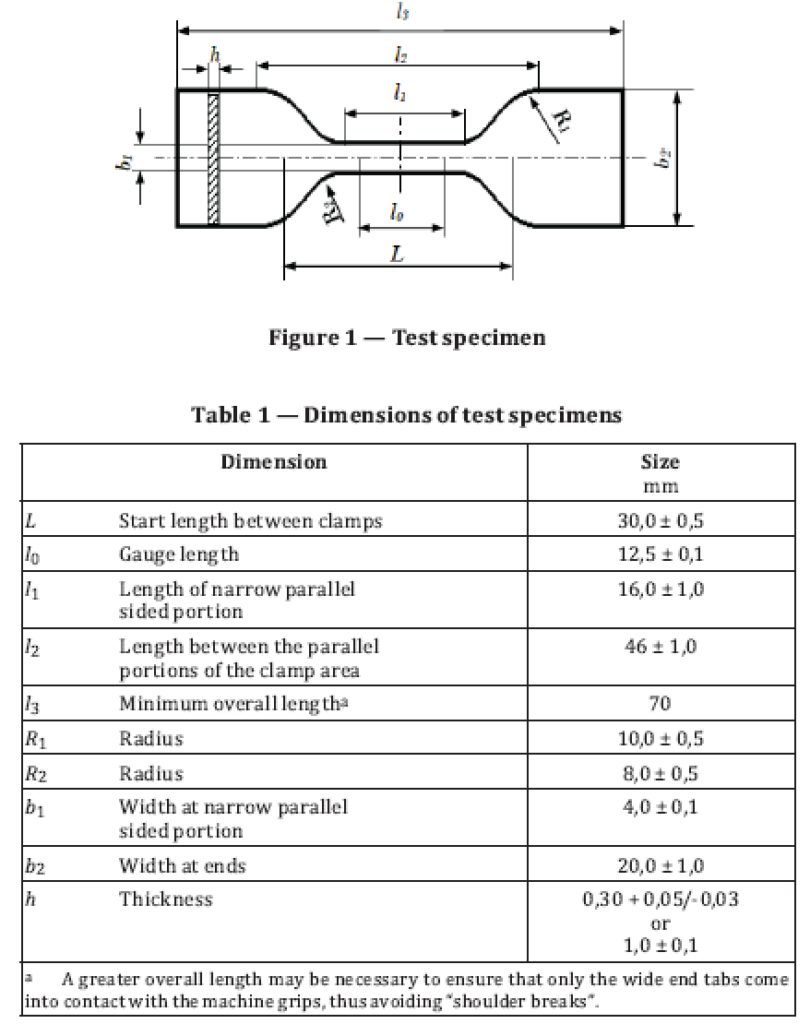
7.1 Specimen dimensions
| Designation | Description | Requirement |
| L | Start length between clamps | 30.0 ± 0.5 mm |
| l0 | Gauge length | 12.5 ± 0.1 mm |
| l1 | Length of narrow parallel-sided portion | 16.0 ± 1.0 mm |
| l2 | Length between parallel portions of clamp area | 46 ± 1.0 mm |
| l3 | Minimum overall length | 70 mm minimum |
| R1 | Radius | 10.0 ± 0.5 mm |
| R2 | Radius | 8.0 ± 0.5 mm |
| b1 | Width of narrow parallel section | 4.0 ± 0.1 mm |
| b2 | Width at ends | 20.0 ± 1.0 mm |
| h | Thickness | 0.30 mm (+0.05/-0.03) or 1.0 ± 0.1 mm |
A large clamping area is required so the specimen does not slip while the gauge section undergoes very large extension. The standard notes that greater overall length may be necessary with some grips so only the wide end tabs contact the grips and shoulder breaks are avoided.
7.2 Compression moulding conditions
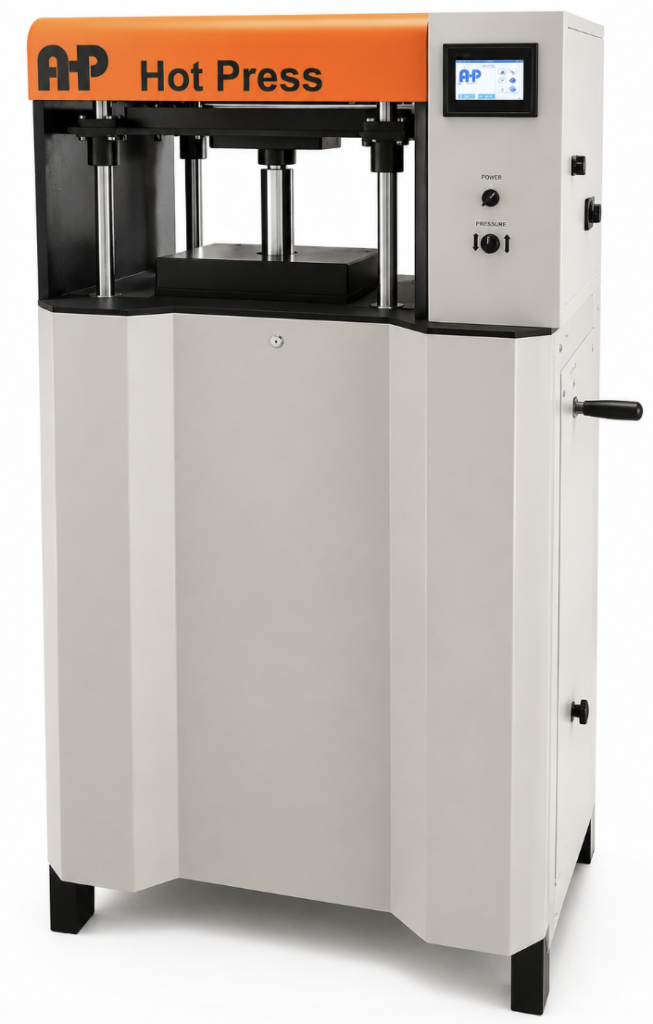
| Sheet thickness | Moulding temperature | Average cooling rate | Preheating time | Full pressure | Full-pressure time |
| 0.30 or 1.0 mm | 180 °C | 15 ± 2 °C/min | 5 to 15 min | 5 MPa | 5 ± 1 min |
7.3 Annealing
STANDARD REQUIREMENT: After compression moulding, the sheet is conditioned for 1 h at 120 ± 2 °C and then cooled slowly to room temperature with an average cooling rate below 2 °C/min. Free movement of the sheet must be allowed.
The slow cooling step is intentionally different from the faster cooling used during moulding. It reduces the influence of uncontrolled thermal history before test specimens are produced.
7.4 Punching and number of specimens
STANDARD REQUIREMENT: Five test pieces are punched from the prepared sheet. The punching process must not introduce deformation, crazes, or other irregularities.
The standard requires at least five specimens to be tested. If a specimen is rejected because of slippage or early failure, the result is discarded and the test must be repeated so that the valid dataset remains compliant.
7.5 Thickness, width, and gauge marks
STANDARD REQUIREMENT: Thickness is measured at three points in the parallel region. The lowest of the three measured thickness values is used in data analysis.
Gauge marks are applied equidistant from the specimen midpoint so that the specified initial gauge length l0 is maintained. These marks are the reference for the extensometer and the draw-ratio calculation.
8. ISO 18488 – Detailed Test Procedure
8.1 Pre-test dimensional measurements
STANDARD REQUIREMENT: Measure width b to 0.01 mm accuracy and thickness h to 0.005 mm accuracy for every individual specimen.
The original cross-sectional area is calculated separately for each specimen. This prevents sheet-to-sheet or specimen-to-specimen dimensional variation from being hidden in the final modulus.
8.2 Thermal conditioning before loading
STANDARD REQUIREMENT: Condition the test specimen for at least 30 min in the temperature chamber at 80 ± 1 °C before the test starts.
8.3 Clamping sequence
- Clamp the test piece in the upper grip using a clamping system that prevents damage and slippage.
- Close the temperature chamber.
- After the specimen has reached 80 ± 1 °C, clamp the lower end.
- Keep the specimen between the grips for at least 1 min before applying load and beginning the measurement.
ENGINEERING IMPLEMENTATION NOTE: The staged clamping sequence minimizes thermal disturbance and reduces the risk of introducing an uncontrolled initial load while the specimen is still stabilizing at temperature.
8.4 Pre-stress and tensile loading
STANDARD REQUIREMENT: Apply a pre-stress of 0.4 MPa at a speed of 5 mm/min. During the test, measure both load and elongation. Then extend the specimen at a constant traverse speed of 20 mm/min.
8.5 Required data range
STANDARD REQUIREMENT: Collect data from λ = 8.0 until λ = 12.0 or until specimen breakage. Reject a specimen that breaks before λ = 8.5.
The analysis region is therefore deliberately far beyond initial yield. The strain-hardening modulus is not a conventional small-strain elastic modulus; it represents the slope of the highly drawn polymer response.
8.6 Validity conditions
- At least five valid specimens are required.
- Any test affected by specimen slippage in the grips is discarded and repeated.
- A specimen breaking before λ = 8.5 is rejected.
- The true-stress/Neo-Hookean fit must achieve R² > 0.9 during data analysis.
9. ISO 18488 – Calculations and Neo-Hookean Data Analysis
9.1 Original cross-sectional area
For each specimen, calculate the original cross-sectional area from the measured width and the thickness value used for analysis:
A = b × h
Because the specimen is thin, even small thickness errors materially affect calculated stress. This is why the standard specifies both measurement resolution and use of the lowest measured thickness.
9.2 Draw ratio
The draw ratio is calculated as:
λ = l / l0 = 1 + Δl / l0
where l0 is the initial gauge length, l is the instantaneous gauge length, and Δl is the increase in gauge length.
9.3 True stress
The standard assumes conservation of volume between the gauge marks. The true stress is therefore calculated from measured force and draw ratio as:
σtrue = λ × F / A
where F is the measured tensile force and A is the initial cross-sectional area.
9.4 Neo-Hookean constitutive model
ISO 18488 represents the high-draw response with a Neo-Hookean form:
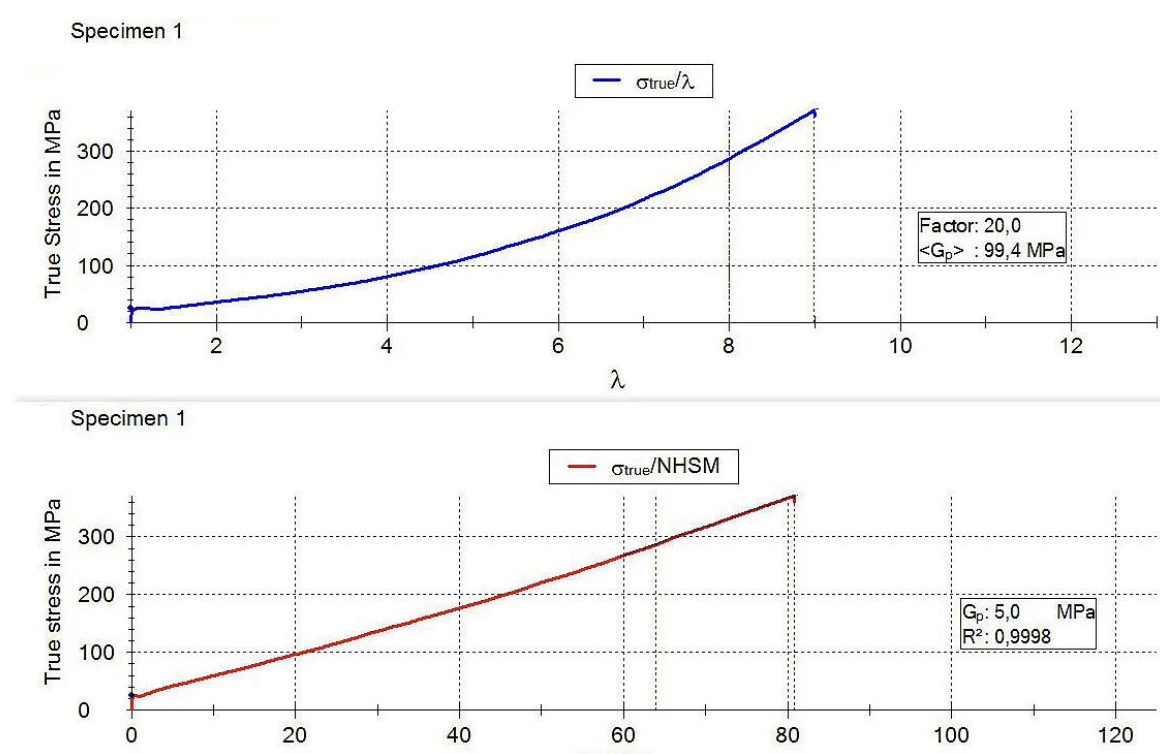
σtrue = (<Gp> / 20) × (λ² – 1/λ) + C
In this expression, <Gp> is the reported strain hardening modulus and C is a mathematical intercept parameter associated with extrapolated yield behavior. The model converts the nonlinear large-deformation response into a relationship from which a slope parameter can be determined.
9.5 Analysis interval and regression quality
STANDARD REQUIREMENT: The model is fitted to the high-draw data for the prescribed region between approximately λ = 8 and λ = 12, and the fit must have R² greater than 0.9.
The informative annex explains the underlying linear-regression concept and associates the strain-hardening response with molecular entanglement and fibril deformation resistance. The primary engineering value is the reproducible slope in the highly oriented region, not the initial elastic or yield response.
9.6 Interpretation of <Gp>
Within the context of ISO 18488, <Gp> is used as a material discrimination parameter related to SCG resistance. A higher strain-hardening response generally indicates greater resistance of the molecular network to the deformation and disentanglement mechanisms that accompany crack growth. The standard does not convert <Gp> into a direct service-life value for a pipe.
10. ISO 18488 – Result Validation, Rejection Criteria, and Test Report
10.1 Reasons for rejection or repetition
| Observed issue | Required / appropriate action | Reason |
| Break before λ = 8.5 | Reject specimen | Insufficient high-draw region for valid strain-hardening analysis. |
| Grip slippage | Discard result and repeat | Measured elongation no longer represents gauge-section strain. |
| R² ≤ 0.9 | Do not accept fit as compliant | Neo-Hookean fit quality does not meet the standard criterion. |
| Visible punching damage or crazing | Do not use damaged specimen | Preparation defect may cause premature failure. |
| Temperature outside 80 ± 1 °C | Investigate/repeat as necessary | Specified test condition was not maintained. |
10.2 Test report content
The ISO 18488 test report includes the following information. The list below preserves the substance of the standard while using original wording for this guide:
- Reference to ISO 18488:2015.
- Complete identification of the tested material and test-piece origin, including type, source, manufacturer designation, manufacturing method, and production date where relevant.
- Minimum thickness of each specimen.
- Mean width of each specimen.
- Identification/number of each tested specimen.
- Yield stress for each specimen.
- Mean and standard deviation of yield stress for the full specimen set.
- Calculated strain hardening modulus for each specimen.
- Mean strain hardening modulus and coefficient of variation for the full specimen set.
- Test temperature and any recorded variation.
- Identification of rejected/replaced specimens and reasons for rejection or testing of nonconforming specimens.
- Any incident or operating detail that may have affected the result.
- Date of measurement.
11. ISO 18489:2015 – Scope, Principle, and Terminology
11.1 Scope
ISO 18489 specifies a method for determining resistance to slow crack growth of polyethylene materials, pipes, and fittings. Samples may be machined from compression-moulded sheet, extruded pipe, or injection-moulded fittings, provided adequate thickness is available for the CRB geometry.
STANDARD REQUIREMENT: The method is intended for accelerated fracture-mechanics characterization at ambient temperature around 23 °C and is particularly identified for PE80 and PE100 pipe materials.
11.2 Principle
A cylindrical specimen containing a circumferential razor-sharp notch is subjected to cyclic tensile loading with constant load range. The load is selected to generate slow crack growth rather than predominantly ductile failure. The number of cycles to final failure, Nf, is recorded as a function of the applied stress range, Δσ0, corresponding to the measured initial crack length.
The geometry creates high constraint and limited global plastic deformation near the crack tip. This promotes relatively rapid crack initiation and shortens the overall test time. The standard notes that crack initiation may also be monitored with extensometers if desired.
11.3 Terms and symbols
| Term | Symbol | Unit / relationship | Meaning |
| Crack length | a | mm | Depth from external surface to crack tip at any time. |
| Cycle | N | – | Smallest repeated segment of the load-time or stress-time function. |
| Failure cycle number | Nf | cycles | Total cycles from test start to specimen failure. |
| Frequency | f | Hz | Number of cycles per second. |
| Initial crack length | aini | mm | Measured crack depth at the beginning of the test, determined from the fracture surface after the test. |
| Initial ligament diameter | Dini | mm | Remaining inner diameter after notching: Dini = D – 2aini. |
| Load ratio | R | Fmin/Fmax | Ratio of minimum load to maximum load. |
| Load range | ΔF | N | Difference between Fmax and Fmin. |
| Maximum load | Fmax | N | Highest load in one cycle. |
| Minimum load | Fmin | N | Lowest load in one cycle. |
| Notch distance | Lmin | mm | Minimum distance from the notch to the clamping system. |
| Target initial crack length | aini* | mm | Target razor-notch depth before the test. |
| Target initial ligament diameter | Dini* | mm | Target remaining diameter after notching. |
| Target stress range | Δσ0* | MPa | Target difference between maximum and minimum stress at test start. |
| Specimen diameter | D | mm | Diameter of the cylindrical CRB specimen. |
| Specimen length | L | mm | Total specimen length. |
| Stress range | Δσ0 | MPa | Applied stress range corrected using the measured initial crack depth. |
| Waveform | – | – | Shape of load-time curve within one cycle. |
12. ISO 18489 – Apparatus and Cyclic Loading System
12.1 Loading system
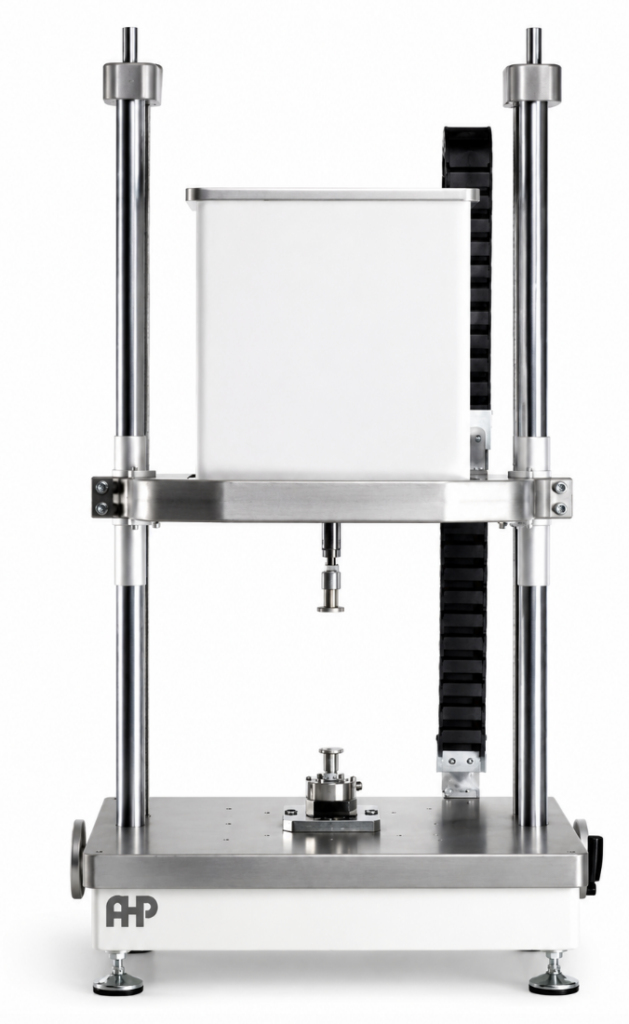
STANDARD REQUIREMENT: The system must impose and record a time-varying cyclic load in load-control mode between accurately defined limits and with a specified waveform.
Servo-hydraulic machines with electronic control are generally suitable, although mechanically driven systems may be used when they meet all relevant requirements.
12.2 Waveform and load stability
STANDARD REQUIREMENT: The cyclic load is sinusoidal and is defined by Fmax and the load ratio R. Maximum and minimum loads must remain constant throughout the test within ±1 %.
12.3 Frequency
STANDARD REQUIREMENT: The load-cycle frequency must not exceed 10 Hz and must be controlled to 1 % accuracy.
At 10 Hz, hysteretic heating is normally not expected to significantly influence Nf according to the standard. If unusual heating near the crack tip is suspected, the frequency is reduced to 5 Hz or 1 Hz, again with 1 % accuracy.
12.4 Grips and alignment
STANDARD REQUIREMENT: The grips must be suitable for cylindrical specimens and the applied load must be aligned with the specimen axis.
Bending or twisting changes the stress field at the circumferential notch and can create nonuniform crack growth. Alignment is therefore a central validity issue in CRB testing.
12.5 Temperature chamber
STANDARD REQUIREMENT: For temperatures other than 23 ± 2 °C, the machine must have a suitable chamber/environmental system that maintains the specimen within ±2 °C of the specified temperature and uses materials compatible with the test environment.
12.6 Microscope
STANDARD REQUIREMENT: Use a microscope or equivalent device with 0.01 mm accuracy to measure the initial crack length after completion of the cyclic test.
12.7 Notching apparatus
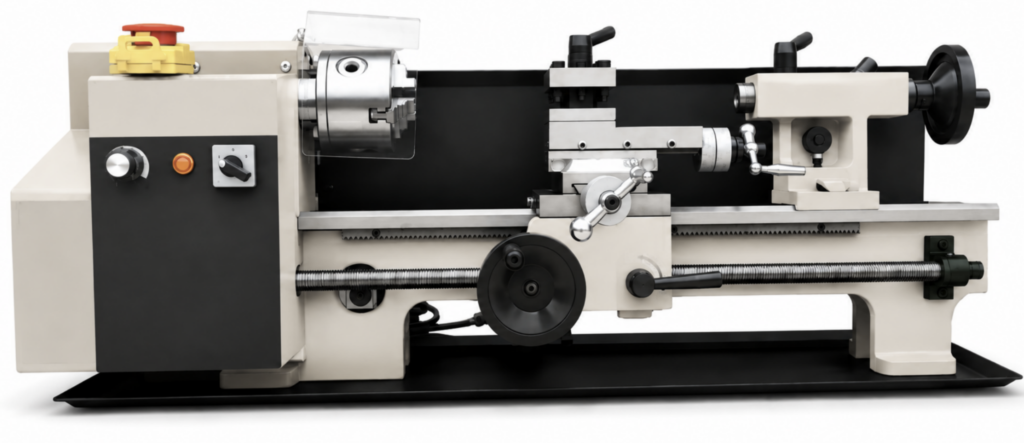
STANDARD REQUIREMENT: The notching device must produce a circumferential razor-sharp notch with a tip radius below 10 μm and maintain the notch perpendicular to the specimen axis.
A conventional lathe with a razor-blade tool can be suitable. Blade bending must be prevented because it can distort notch geometry and create a nonuniform initial crack front.
13. ISO 18489 – CRB Specimen Geometry, Machining, and Notching
13.1 Preferred CRB geometry
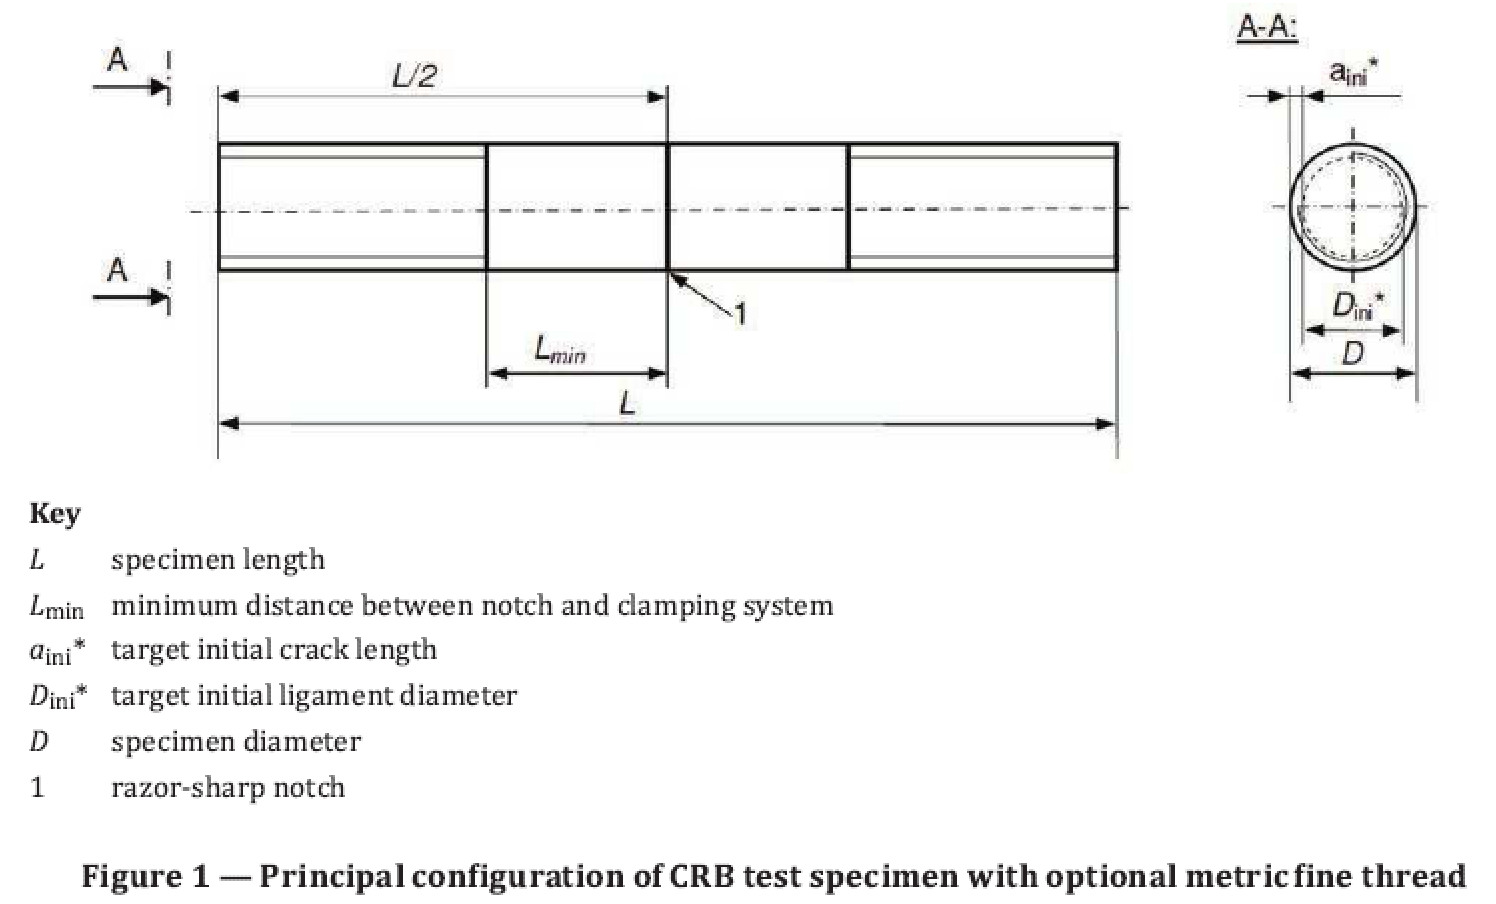
| Parameter | Symbol | Preferred requirement |
| Specimen length | L | 80 to 100 mm |
| Specimen diameter | D | 14 mm |
| Target initial crack length | aini* | 1.50 mm (+0.15/-0.00 mm) |
| Minimum notch-to-grip distance | Lmin | At least 20 mm |
| Optional thread | – | M14 × 1.0 metric fine thread may be used for clamping |
The notch is circumferential and located in the middle of the cylindrical specimen. The target initial ligament diameter follows directly from the specimen diameter and target crack depth:
Dini* = D – 2aini*
13.2 Source material and machining
CRB specimens can be machined from compression-moulded sheet, extruded pipe, or injection-moulded fittings. Machining is carried out in accordance with ISO 2818. The standard explicitly warns that different compression-moulding conditions can affect test results, so preparation history must be controlled when comparing materials.
13.3 Compression moulding conditions
| Moulded thickness | Moulding temperature | Average cooling rate | Preheating time | Full pressure | Full-pressure time |
| <10 mm | 180 °C | 15 ± 2 °C/min | 20 min | 5 MPa | 10 min |
| 10 to 16 mm | 180 °C | 2 ± 0.5 °C/min | 45 min | 10 MPa | 25 min |
STANDARD REQUIREMENT: Demoulding temperature is below 40 °C. During preheating, only contact pressure is used.
13.4 Notching conditions
STANDARD REQUIREMENT: Notch specimens at 23 ± 2 °C.
The standard gives favorable practical values of approximately 80 to 100 rpm driving speed and approximately 0.03 mm per rotation razor-blade feed. The purpose is to avoid frictional heating, notch-tip blunting, and residual stresses.
STANDARD REQUIREMENT: Use each razor blade for no more than 10 notches.
The notch must remain perpendicular to the specimen axis. Any angular notch can create asymmetric crack propagation and invalidate comparison with correctly prepared specimens.
14. ISO 18489 – Conditioning and Detailed Test Procedure
14.1 Specimen conditioning before test
STANDARD REQUIREMENT: Unless otherwise specified, store notched specimens at ISO 291 condition 23/50, Class 2 before testing. A minimum of 24 h preconditioning at this condition is recommended.
The standard notes that the interval between notching and testing is not highly significant, but recommends the 24 h preconditioning period as good practice within the method.
14.2 Diameter measurement
STANDARD REQUIREMENT: Before testing, measure D on both sides of the notch at a distance of 1 to 2 mm from the notch, with at least 0.1 mm accuracy. Use the average of the two measurements. Do not measure the diameter directly at the notch.
14.3 Specimen mounting
STANDARD REQUIREMENT: Mount the specimen without inducing additional forces, bending, or twisting. Maintain sufficient notch-to-grip distance Lmin to prevent clamping effects at the crack tip.
14.4 Test atmosphere
STANDARD REQUIREMENT: The preferred test atmosphere is ISO 291 condition 23/50, Class 2 unless a referring standard specifies otherwise.
STANDARD REQUIREMENT: For elevated-temperature testing, condition the unloaded mounted specimen at test temperature for at least 2 h before loading.
14.5 Selection of stress range
STANDARD REQUIREMENT: Use a load ratio R = 0.1 unless a referring standard specifies otherwise.
| Base-polymer density | Typical target stress range Δσ0* |
| ρ ≤ 945 kg/m³ | 10.5 to 12.5 MPa |
| ρ > 945 kg/m³ | 11.5 to 13.5 MPa |
STANDARD REQUIREMENT: Target stress ranges above 13.5 MPa should be avoided because they may produce ductile failure.
At least four specimens are tested at each applied target stress range, with stress levels distributed through the applicable range. For an unknown material, preliminary tests are recommended to confirm that the selected loads generate SCG rather than ductile failure.
For a product specification, the standard notes that a single-point requirement may be established at one load range.
14.6 Cyclic load application
- Mount and condition the specimen as required.
- Apply the cyclic load immediately at the defined frequency without exceeding the calculated Fmax.
- Avoid static preloading before the cyclic test because it may cause creep at the notch tip.
- Start the cycle counter simultaneously with the cyclic load.
- Apply and record the cyclic load continuously until specimen failure.
14.7 Post-test crack-depth measurement
The actual initial crack depth aini is measured after the cyclic test from the fracture surface. The smooth ring-like surface produced by the razor notch can normally be distinguished from the surface created by subsequent fatigue/SCG crack extension. A microscope or equivalent device is used for this measurement.
15. ISO 18489 – Load and Stress Calculations
15.1 Load ratio and load range
The load ratio is:
R = Fmin / Fmax
The cyclic load range is:
ΔF = Fmax – Fmin
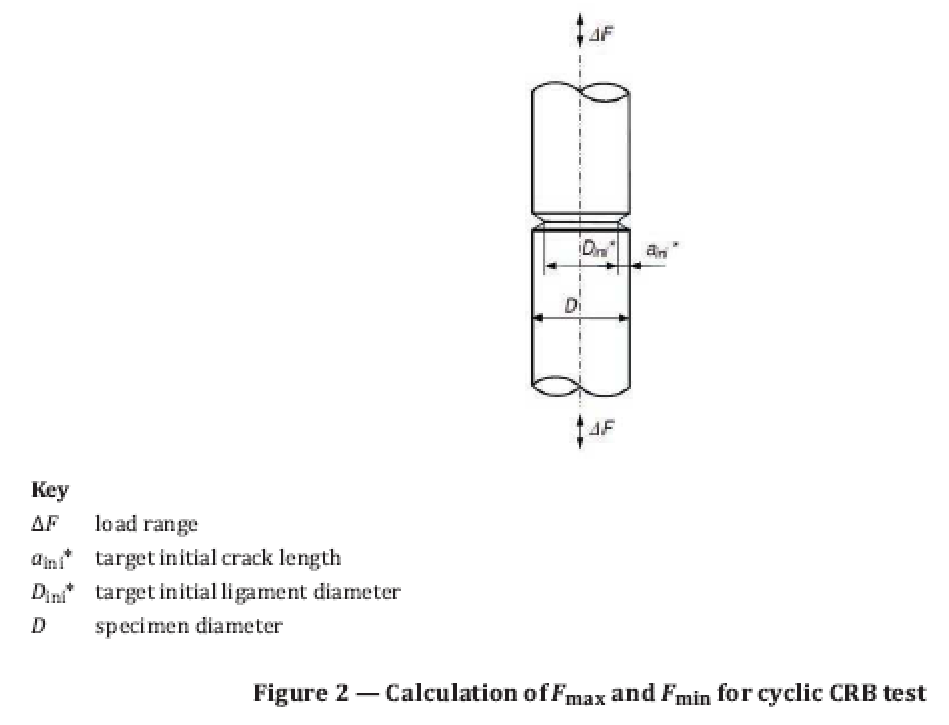
15.2 Target ligament diameter
For the target notch depth, the remaining ligament diameter is:
Dini* = D – 2aini*
15.3 Maximum and minimum load
For the preferred geometry, the target stress range is applied to the circular ligament area. Rearranging the relationship between stress range and load range gives the maximum load:
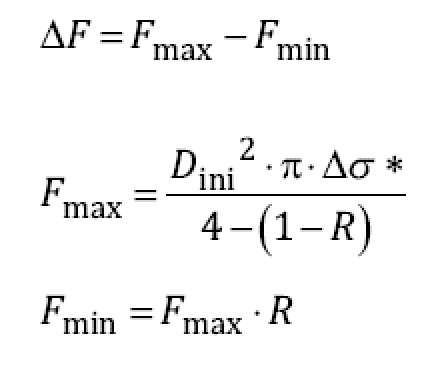
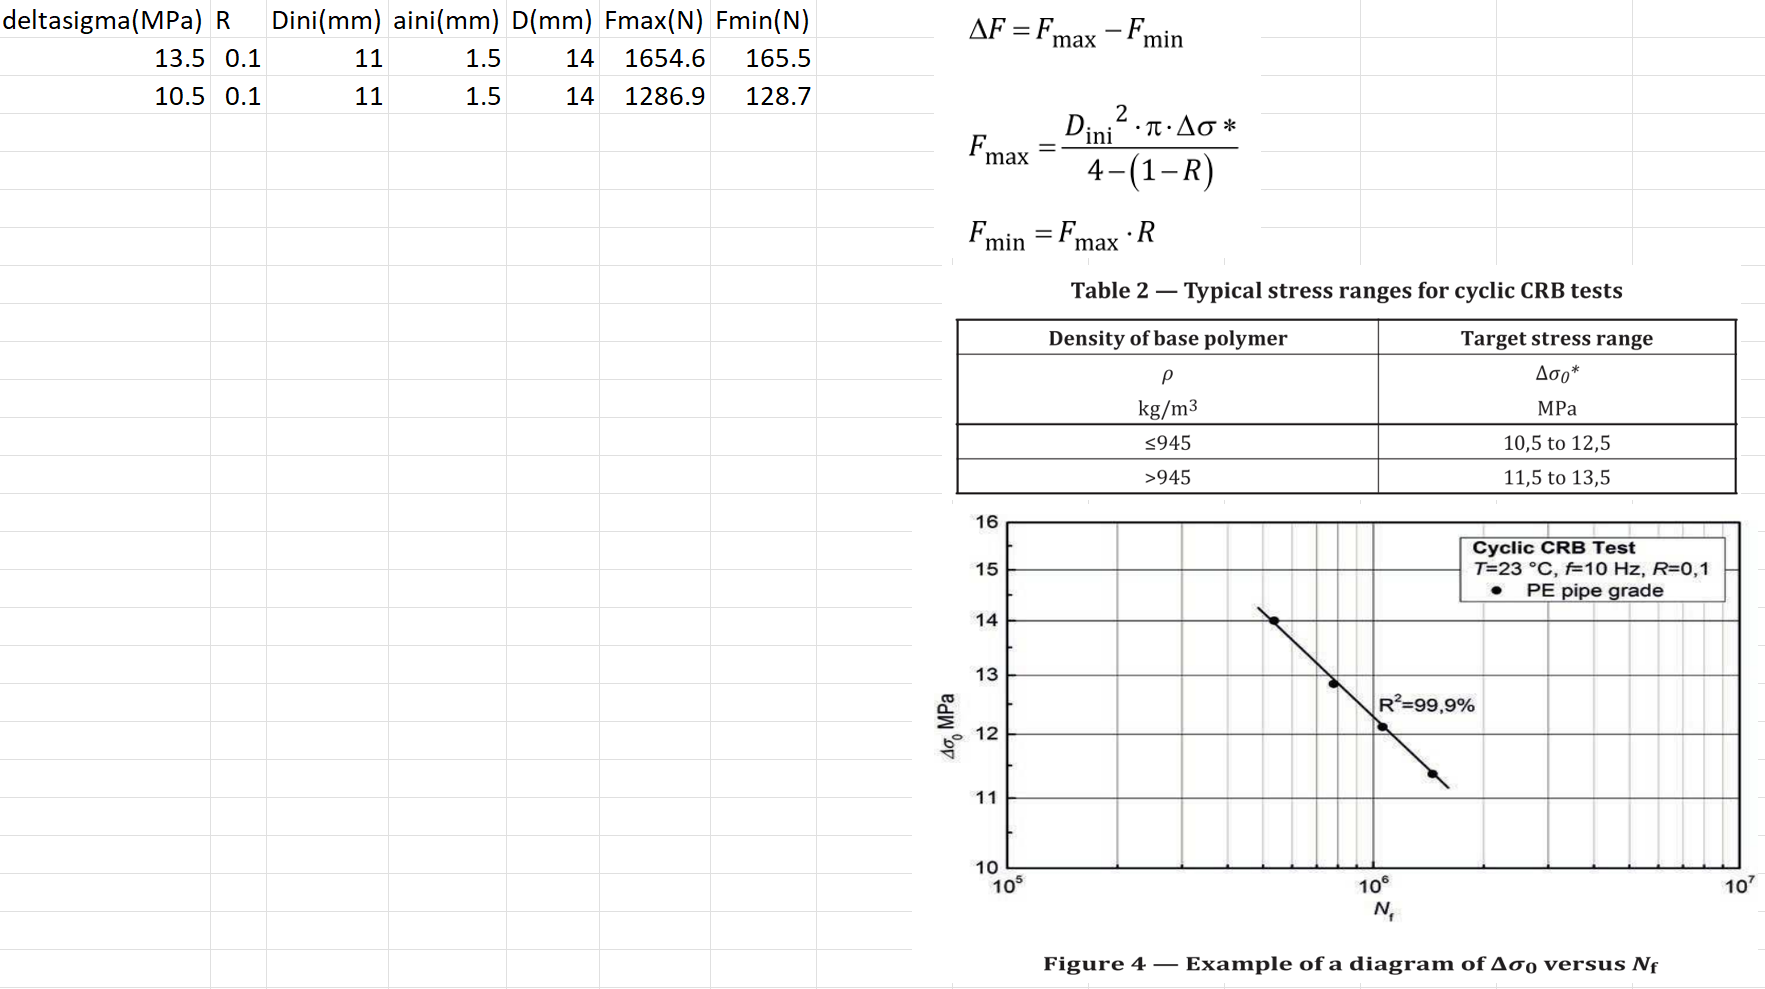
and ΔF = Fmax – Fmin. These equations allow the test controller to be programmed from the measured/target specimen geometry, selected stress range, and load ratio.
15.4 Corrected actual stress range
Because the exact razor-notch depth is determined after failure, the actual initial ligament diameter can differ from the target value. The applied stress range is therefore corrected using the measured aini:
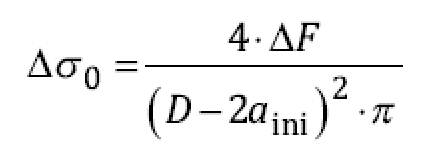
This corrected Δσ0, rather than only the target Δσ0*, is the stress range used in the final failure-cycle relationship.
16. ISO 18489 – Fracture-Surface Assessment and Data Treatment
16.1 Fracture-mode validity
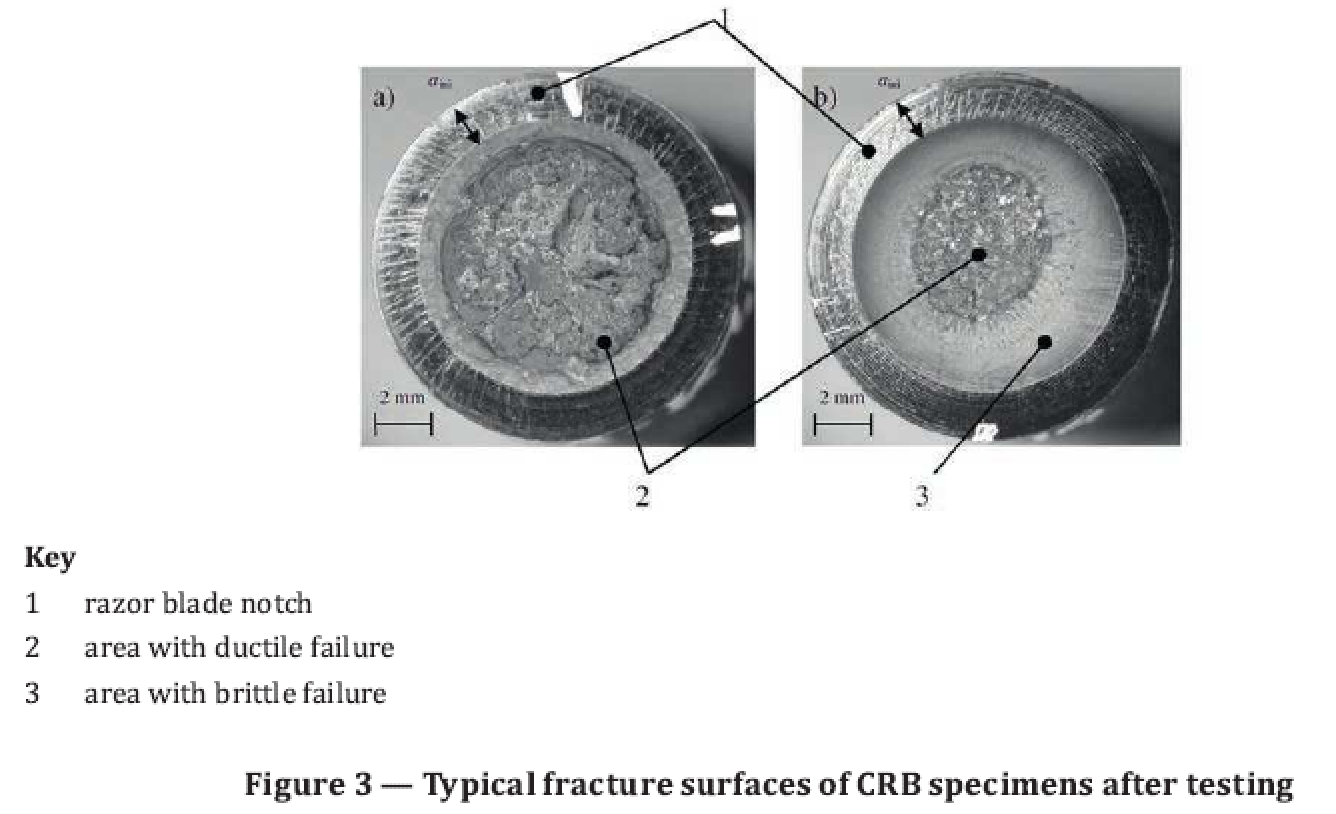
STANDARD REQUIREMENT: Only specimens showing predominantly brittle fracture are included in the data evaluation.
The fracture surface generally contains distinguishable regions: a smooth ring corresponding to the razor notch, a slow-crack-growth/brittle region, and a final ductile region when the remaining ligament becomes small. A specimen that failed predominantly by ductile deformation indicates that the applied stress was too high for the intended SCG mechanism and must be excluded from evaluation.
16.2 Failure cycle number
Nf is the total number of load cycles from the beginning of cyclic loading until final specimen failure. Because the method is a fatigue-style test, Nf is strongly dependent on applied stress range; a single Nf value is therefore meaningful only together with the corresponding Δσ0, specimen geometry, frequency, R ratio, and temperature.
16.3 Log-log failure relationship
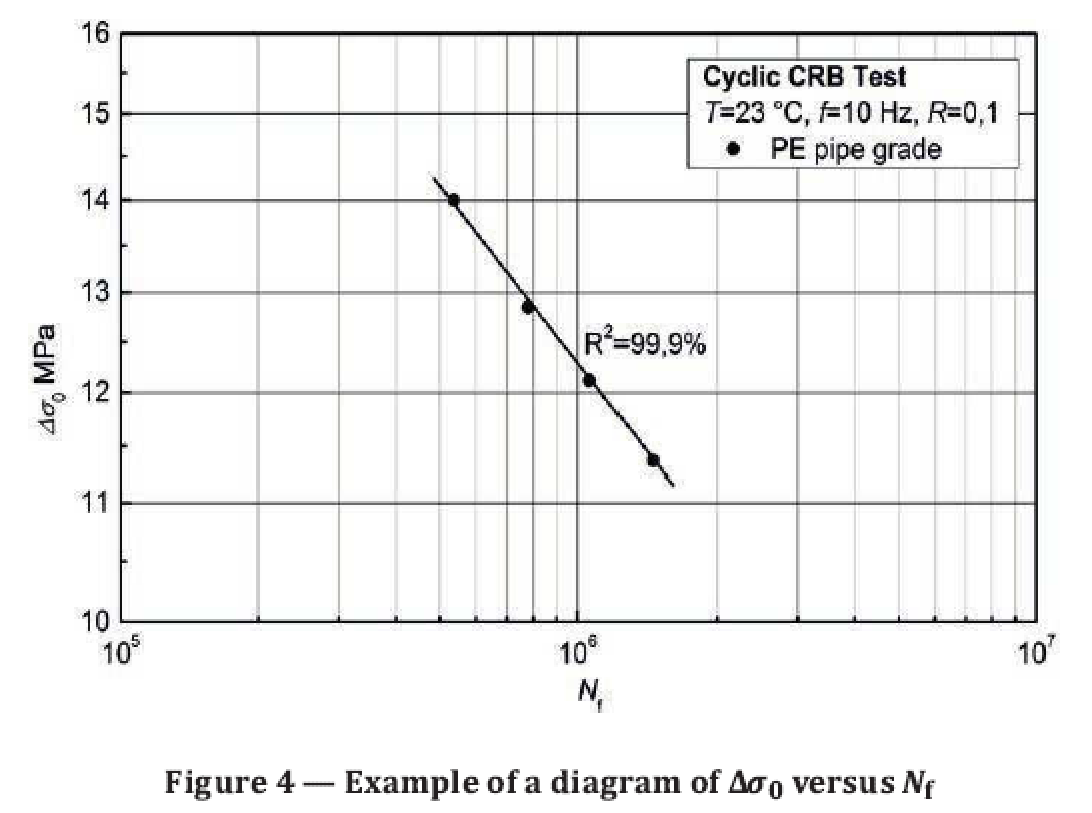
STANDARD REQUIREMENT: Display Nf as a function of Δσ0 in a double-logarithmic (log-log) diagram.
STANDARD REQUIREMENT: The failure curve must show a linear correlation with an accuracy within at least a 98 % confidence interval. If a clear linear relationship is not obtained, additional tests at suitable stress ranges are performed.
The plot must also identify specimen configuration, test temperature, load-cycle frequency, and R ratio. These variables are necessary because changes in geometry or loading can alter the crack-driving force and therefore the observed life.
16.4 Comparison limits
STANDARD REQUIREMENT: Direct comparison by stress range is allowed only when specimen geometry and test parameters are the same.
When specimen diameter differs from the preferred 14 mm configuration, the standard requires comparison through the stress-intensity-factor range rather than Δσ0 alone.
17. ISO 18489 – Alternative Diameters and Stress-Intensity-Factor Approach
The informative annex addresses CRB specimen diameters from 10 mm to 14 mm. For such alternative sizes, the target initial crack length may be taken as approximately 10 % of specimen diameter. Because a given nominal stress range does not produce exactly the same crack-tip intensity in different geometries, Nf versus Δσ0 is not a valid direct comparison across different specimen diameters.
STANDARD REQUIREMENT: For alternative-diameter comparison, use the stress-intensity-factor range ΔKI. The annex indicates a ΔKI range of approximately 0.62 to 0.70 MPa·m^0.5 to avoid ductile failure in the CRB specimen.
The annex uses the Benthem-Koiter crack-geometry solution for a circumferential crack in a round bar. Its inputs include cyclic load range ΔF, specimen radius r, crack depth a, remaining ligament radius b = r – a, and a geometry function f(b/r). For calculation software or formal conformity work, the exact Annex A equation and coefficients should be implemented directly from an authorized copy of ISO 18489.
ENGINEERING IMPLEMENTATION NOTE: This manual intentionally explains the calculation architecture without reproducing the full copyrighted annex coefficient expression. A laboratory calculation worksheet should store the controlled formula version and revision traceably.
18. ISO 18489 – Test Report Requirements
A complete CRB report includes substantially more information than Nf alone because the validity of the result depends strongly on specimen preparation, notch geometry, fracture mode, and cyclic loading conditions.
- Reference to ISO 18489:2015.
- Name of test laboratory and operating person(s).
- Complete identification of material/product and each specimen, such as PE base polymer or compound, product type, manufacturer, and production date.
- Details of specimen preparation, including cutting and dimensions.
- Details of notching procedure and specimen conditioning.
- Details of the test equipment.
- Test atmosphere.
- Loading variables including corrected stress range Δσ0, maximum stress/load information as applicable, R, Nf, frequency f, and cycle waveform.
- Measured notch depth aini from the fracture surface.
- Photograph of the CRB fracture surface after testing.
- Diagram of Δσ0 versus Nf.
- Any deviations, incidents, or operations outside the specified method that may affect results.
- Start and end dates of the test.
19. Side-by-Side Comparison of ISO 18488 and ISO 18489
| Technical aspect | ISO 18488:2015 – SHM | ISO 18489:2015 – CRB |
| Measured response | High-draw tensile strain hardening | Cycles to failure under cyclic crack loading |
| Primary result | <Gp> in MPa | Nf as a function of corrected Δσ0; ΔKI when geometry differs |
| Specimen source | Compression-moulded PE sheet | Compression-moulded sheet, extruded pipe, or injection-moulded fitting |
| Specimen type | Thin dog-bone style tensile specimen | Circumferentially notched cylindrical bar |
| Typical test temperature | 80 ± 1 °C | Preferably 23/50 condition; other temperatures allowed |
| Loading | Monotonic tension | Sinusoidal cyclic tension |
| Speed/frequency | 20 ± 2 mm/min machine capability; test at 20 mm/min | ≤10 Hz; reduce to 5 or 1 Hz if heating is suspected |
| Number of specimens | At least five valid specimens | At least four specimens at each stress range for curve generation |
| Core validity issue | Adequate draw range and no slippage | Predominantly brittle SCG failure, correct notch and alignment |
| Data quality criterion | Neo-Hookean fit R² > 0.9 | Log-log linear relation with at least 98 % confidence requirement |
| Direct physical emphasis | Molecular network strain hardening/disentanglement resistance | Fracture propagation under a defined cyclic crack-driving force |
| Testing burden | Relatively rapid once specimens are prepared | Higher: precision machining, notching, cyclic testing, microscopy, multiple stress levels |
19.1 What the two methods can and cannot be used for
Both methods can support material ranking and SCG-related characterization, but neither standard by itself provides a complete prediction of installed pipe lifetime. Real service performance additionally depends on pipe geometry, internal pressure, operating temperature, installation damage, residual stresses, joints, chemicals, external loads, and product manufacturing quality.
ISO 18488 is especially useful when a rapid intrinsic material parameter is needed. ISO 18489 is especially useful when direct fracture behavior under controlled cyclic loading is required. In a material-development program, it is reasonable to use ISO 18488 as a fast screen and ISO 18489 for more detailed confirmation, provided this strategy is consistent with the governing product specification.
20. Laboratory Quality Assurance and Measurement Control
20.1 Equipment control
- Use force-measurement systems whose calibration status is current and whose capacity is appropriate for the test force range.
- For ISO 18488, verify extensometer calibration and tracking at large deformation; do not substitute crosshead displacement.
- For ISO 18489, verify cyclic load amplitude, R ratio, sinusoidal waveform, frequency, and cycle counter before testing.
- Check environmental chamber stability and specimen temperature rather than relying only on controller setpoint.
- Inspect grips for wear, slippage, eccentricity, or damage that can introduce bending.
- Control microscope calibration and image scale for CRB notch-depth measurements.
20.2 Specimen traceability
The standards require material and specimen identification in the final report. A robust laboratory record should therefore assign a unique specimen ID and preserve source material, batch/lot, product type, manufacturing date, extraction location, orientation, moulding history, machining history, notching details, operator, and measurement data. These are implementation recommendations that strengthen traceability without changing the formal test method.
20.3 Environmental records
Record chamber setpoint, measured temperature, conditioning start/end time, and any temperature excursions. For CRB tests at elevated temperature, document the minimum 2 h conditioning time of the unloaded mounted specimen. For SHM tests, document the minimum 30 min pre-test conditioning at 80 ± 1 °C.
20.4 Data integrity
Raw force and elongation or force-cycle data should be retained so calculations can be independently reproduced. Calculated results should be linked to a controlled spreadsheet, validated script, or laboratory information system. Any manual exclusion of a specimen should carry a documented reason consistent with the standard validity rules.
21. Common Sources of Error and Troubleshooting
| Problem | Likely cause | Technical consequence | Corrective action |
| ISO 18488 specimen breaks early | Edge damage, poor punching, unsuitable clamping, material behavior | Insufficient λ range | Inspect edges and die; review grip contact; replace damaged specimen. |
| ISO 18488 strain data inconsistent | Extensometer tracking loss or grip slippage | Incorrect λ and <Gp> | Verify gauge marks, optical contrast, alignment, and grip pressure. |
| ISO 18488 poor R² | Noisy strain data, irregular deformation, insufficient valid range | Invalid model fit | Review raw curve and tracking; repeat when necessary. |
| CRB failure is ductile | Stress range too high | Not SCG-dominated; result excluded | Reduce Δσ0* and repeat preliminary range selection. |
| CRB crack grows eccentrically | Angular notch, bending, misalignment | Nonuniform crack-driving force | Correct notching perpendicularity and fixture alignment. |
| CRB notch appears blunted | Excessive notching speed/feed or worn blade | Reduced crack severity and altered Nf | Reduce frictional heating; use fresh blade within usage limit. |
| CRB specimen heats strongly | High cyclic dissipation | Material response may be altered | Reduce frequency to 5 Hz or 1 Hz as directed by the standard. |
| CRB log-log data are not linear | Stress levels poorly selected, mixed failure mode, scatter | Failure curve not acceptable | Review fracture modes and add tests at suitable stress ranges. |
22. Material Development, Qualification, and Product Testing Strategy
22.1 Resin development
ISO 18488 is well suited to iterative material development because its duration is governed mainly by specimen preparation, thermal conditioning, and tensile-test speed rather than by waiting for a slow crack to propagate for a long time. It can therefore provide relatively fast feedback on changes in molecular architecture that affect the high-draw response.
Candidate materials can then be evaluated using ISO 18489 to determine whether improved intrinsic strain-hardening behavior is accompanied by stronger cyclic crack-growth resistance. This two-stage strategy is an engineering workflow, not a mandatory sequence stated by the standards.
22.2 Pipe and fitting evaluation
ISO 18489 has an important advantage for finished-product evaluation because specimens can be machined from extruded pipe or injection-moulded fittings. This allows the final processed morphology to be included in the test response. When comparing product specimens, extraction position and orientation should therefore be held constant and documented.
22.3 Product specifications and acceptance criteria
Neither uploaded standard establishes a universal acceptance limit for all PE80, PE100, or PE100-RC products. Acceptance criteria must come from the relevant product specification, customer requirement, regulatory document, or material qualification scheme. ISO 18489 explicitly notes that a product specification can establish a single-point requirement at one load range. This manual does not invent pass/fail limits that are absent from the supplied standards.
23. Example Calculation Workflows
The following examples are illustrative engineering calculations. They demonstrate how the standard equations are applied but are not standard test results and must not be used as acceptance criteria.
23.1 ISO 18488 illustrative calculation
Assume a specimen has mean width b = 4.02 mm and the lowest measured thickness h = 0.305 mm. The original cross-sectional area is:
A = 4.02 × 0.305 = 1.2261 mm²
At a measured draw ratio λ = 9.00 and force F = 3.20 N:
σtrue = λ × F / A = 9.00 × 3.20 / 1.2261 ≈ 23.49 MPa
The same calculation is performed for the complete data series in the prescribed high-draw interval. True stress is regressed against the Neo-Hookean strain measure (λ² – 1/λ). The fitted slope is then converted to <Gp> according to the standard model, and the regression must satisfy R² > 0.9.
23.2 ISO 18489 illustrative load calculation
Assume the preferred D = 14.00 mm specimen, target notch depth aini* = 1.50 mm, target stress range Δσ0* = 12.0 MPa, and R = 0.10. The target ligament diameter is:
Dini* = 14.00 – 2(1.50) = 11.00 mm
The ligament area is π(11.00²)/4 ≈ 95.03 mm². The required cyclic load range is approximately 95.03 × 12.0 = 1140.4 N. Because ΔF = Fmax(1 – R):
Fmax ≈ 1140.4 / 0.90 ≈ 1267 N
Fmin = 0.10 × 1267 ≈ 127 N
After fracture, suppose the measured actual crack depth is 1.58 mm. The corrected ligament diameter becomes 14.00 – 2(1.58) = 10.84 mm, and the corrected stress range is calculated from the actual ligament area using Δσ0 = 4ΔF/[π(D – 2aini)²]. The corrected value, not merely the target value, is used in the final Δσ0-Nf relationship.
ENGINEERING IMPLEMENTATION NOTE: For a public website, avoid reproducing figures or long verbatim passages from the ISO documents unless your organization has appropriate publication rights. Original explanatory diagrams and original tables based on engineering interpretation are preferable.
Lets see another sample calculation according to above standard:
Appendix A. ISO 18488 Parameter Checklist
| Control item | Requirement / target | Check |
| Moulded sheet thickness | 0.30 mm or 1.0 mm; 0.30 mm in case of dispute | |
| Moulding temperature | 180 °C | |
| Average moulding cooling rate | 15 ± 2 °C/min | |
| Preheat | 5 to 15 min | |
| Full pressure | 5 MPa | |
| Full-pressure time | 5 ± 1 min | |
| Demoulding temperature | <40 °C | |
| Annealing | 1 h at 120 ± 2 °C | |
| Annealing cooling rate | <2 °C/min | |
| Number of test pieces | At least 5 valid specimens | |
| Gauge length l0 | 12.5 ± 0.1 mm | |
| Narrow width b1 | 4.0 ± 0.1 mm | |
| Width accuracy | 0.01 mm | |
| Thickness accuracy | 0.005 mm | |
| Pre-test conditioning | ≥30 min at 80 ± 1 °C | |
| Pre-stress | 0.4 MPa at 5 mm/min | |
| Tensile speed | 20 mm/min; machine capability 20 ± 2 mm/min | |
| Analysis data range | λ = 8 to 12 or break | |
| Early-break rejection | Reject if break before λ = 8.5 | |
| Slippage | Discard and repeat | |
| Regression quality | R² > 0.9 |
Appendix B. ISO 18489 Parameter Checklist
| Control item | Requirement / target | Check |
| Preferred D | 14 mm | |
| Preferred L | 80 to 100 mm | |
| Target aini* | 1.50 mm (+0.15/-0.00) | |
| Lmin | ≥20 mm | |
| Notching temperature | 23 ± 2 °C | |
| Notch tip radius | <10 μm | |
| Favorable notching speed | 80 to 100 rpm | |
| Favorable blade feed | ~0.03 mm/rotation | |
| Blade usage | ≤10 notches per blade | |
| Preconditioning | 23/50 Class 2; 24 h recommended | |
| D measurement | Two sides, 1-2 mm from notch, ≥0.1 mm accuracy | |
| Preferred test atmosphere | 23/50 Class 2 | |
| Elevated-temperature conditioning | ≥2 h after mounting, unloaded | |
| R | 0.1 | |
| Frequency | ≤10 Hz, 1 % accuracy | |
| Frequency reduction if heating | 5 or 1 Hz | |
| Load stability | Fmax and Fmin constant within ±1 % | |
| Target Δσ0* for ρ ≤945 | 10.5 to 12.5 MPa | |
| Target Δσ0* for ρ >945 | 11.5 to 13.5 MPa | |
| Avoid target Δσ0* | >13.5 MPa | |
| Replicates | At least 4 specimens per stress range | |
| Loading waveform | Sinusoidal | |
| Static preloading | Avoid | |
| Crack-depth measurement | After fracture, 0.01 mm microscope accuracy | |
| Accepted failure mode | Predominantly brittle | |
| Failure plot | log Δσ0 vs log Nf | |
| Correlation requirement | Linear within at least 98 % confidence interval |