2 Principle
Small samples of raw-material pellet or material removed from the pipe or fitting are heated and compressed between microscope slides. Alternatively, a microtome slice can be taken.
The specimens produced are examined microscopically and the sizes of particles and agglomerates are measured, recorded and graded by comparison with a tabulated grading system (see Table A.1).
A particle/agglomerate size grading is determined from an average of the gradings determined for six specimens. If required, a rating of the appearance of the dispersion is determined by comparison with photomicrographs (see annex B).
3 Apparatus
3.1 General
3.1.1 Microscope, capable of producing suitable magnification, see 4.2 and 5.2, with orthogonal travel, a
standard calibrated graticule capable of measuring the particle and agglomerate size, and lighting adequate to avoid optical effects.
3.1.2 Glass microscope slides: 1 mm thickness is suitable, with a thin cover slip.
3.2 For the compression procedure (see 4.1.1)
3.2.1 Oven or hotplate or other type of heating device, capable of operating at a controlled temperature
between 150 °C and 210 °C.
3.2.2 Scalpel, for cutting out specimens.
3.2.3 Press, weights or spring clips, to maintain pressure.
3.3 For the microtome procedure (see 4.1.2)
3.3.1 Microtome, capable of producing a slice of the required thickness (see 4.1.2).
4 Procedure
4.1 Specimen preparation
Two methods of preparation of test specimens are described: a compression procedure and a microtome
procedure.
4.1.1 Compression procedure
4.1.1.1 Using a scalpel (3.2.2), cut six specimens, each of mass 0,6 mg ± 0,2 mg for assessing pigment
dispersion, or each of mass 0,20 mg ± 0,10 mg for assessing carbon black dispersion, from different parts of the product to be analysed (see notes 1, 2, and 3). Place the six specimens on one or more clean microscope slides (3.1.2), with each specimen approximately equidistant from its neighbour and from adjacent edges of the slide (see note 4). Cover with another (or other) clean microscope slide(s) or cover slip(s) (see note 5).
NOTE 1 It should be noted that difficulty will be encountered with the microscopic examination of specimens which are too thick.
NOTE 2 The specimens are preferably cut along different axes of the product.
NOTE 3 It is recommended that cutting out the specimens take place on a clean surface to minimize the possibility of extraneous contamination.
NOTE 4 Adherence of the specimens may be improved by heating the slide or using a drop of immersion oil or Canada balsam.
NOTE 5 Shims made of metal or another suitable material may be used to ensure that uniform thickness is obtained. For the specimen mass and thickness given, a film at least 4 mm across is obtained (see note 1).
4.1.1.2 If an oven (see 3.2.1) is to be used, clamp the two slides together with spring clips (see 3.2.3). Place
the clamped slides in the oven, for instance (see 3.2.1) maintained at a temperature between 150 °C and 210 °C and leave for at least 10 min until each specimen is pressed out to a film of thickness of at least 60 µm ± 20 µm for assessment of pigment dispersion or to a thickness of 20 µm ± 10 µm for assessment of carbon black dispersion (see note 1 to 4.1.1.1).
Remove the slides from the oven and, when they are cool enough to be handled, remove the clips.
4.1.1.3 Alternatively place the slides on a hotplate or other heating device (see 3.2.1) at a temperature
between 150 °C and 210 °C, and apply pressure using a press or a weight sufficient to produce uniform thickness film according to 4.1.1.2.
Cool before removing the slides for the microscopic examination (see 4.2).
4.1.2 Microtome procedure
Cut six specimens from different parts of the product (see note 2 to 4.1.1.1) to produce films of a thickness of 60 µm ± 20 µm for assessment of pigment dispersion or of a thickness of 20 µm ± 10 µm for assessment of carbon black dispersion, and at least 4 mm across in any direction (see note 1 to 4.1.1.1).
Place the six specimens on one or more clean microscope slides (3.1.2), with each specimen approximately equidistant from its neighbour and from adjacent edges of the slide (see note 4 to 4.1.1.1). Cover with another (or other) clean microscope slide(s) or cover slip.
4.2 Microscopic examination
4.2.1 Examination for assessment of degree of dispersion Examine the particles and agglomerates in each of the six specimens in turn through the microscope (3.1.1) under transmitted light with a recommended magnification of × 100 (see note).
Measure and record the largest dimension of each particle and agglomerate, ignoring those less than 5 µm. Grade according to the size categories given in Table A.1.
NOTE Some pigments may be more visible in polarized light or light of a different intensity. If possible, check that the agglomerates are pigment by varying the light intensity and by using different light sources, for instance transmitted, reflected, or polarized light.
4.2.2 Examination for rating of appearance
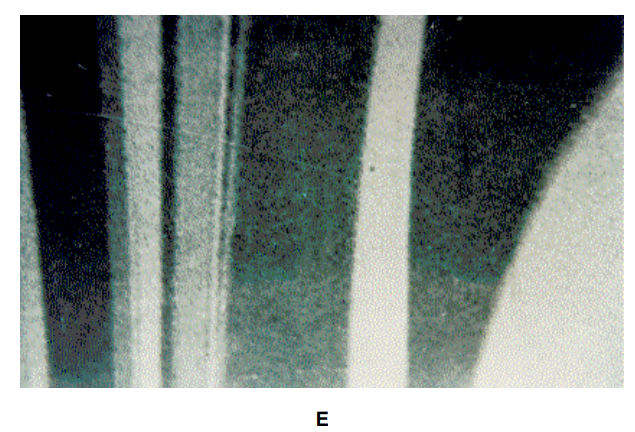
If a rating of the appearance is required, examine each specimen in turn through the microscope (3.1.1) under transmitted light with a magnification of at least × 70. Note the appearance of each specimen in comparison with the photomicrographs (see annex B).
5 Expression of results
5.1 Grading of particle and agglomerate size Using Table A.1, determine the highest particle/agglomerate size grade for each specimen. Calculate the arithmetic mean of the six grades obtained and express the result to a single decimal point, rounded up to the next higher value (see the examples given in annex C).
5.2 Rating of appearance
Note the appearance of each specimen and the overall dominant appearance of the set of specimens.


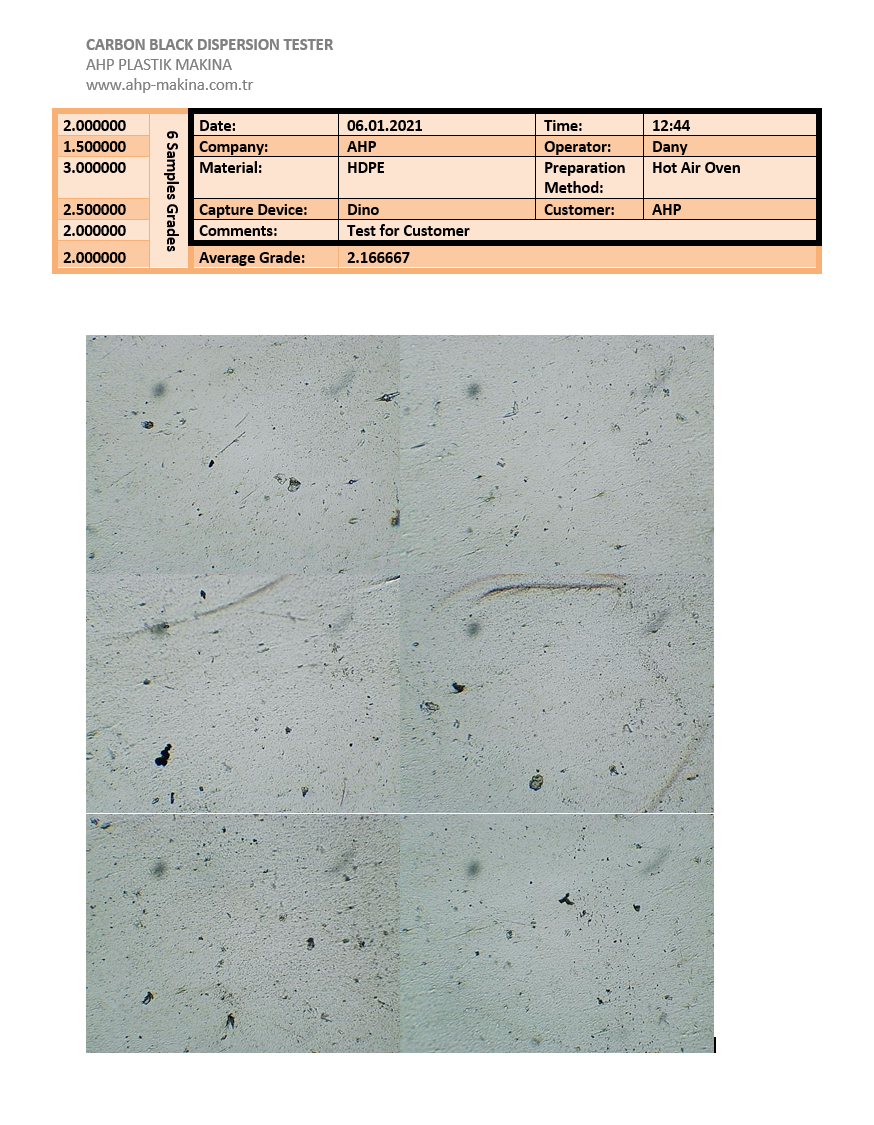
Analysis Software for Dispersion Tester according to ISO 18553
1- Define Sample general parameters

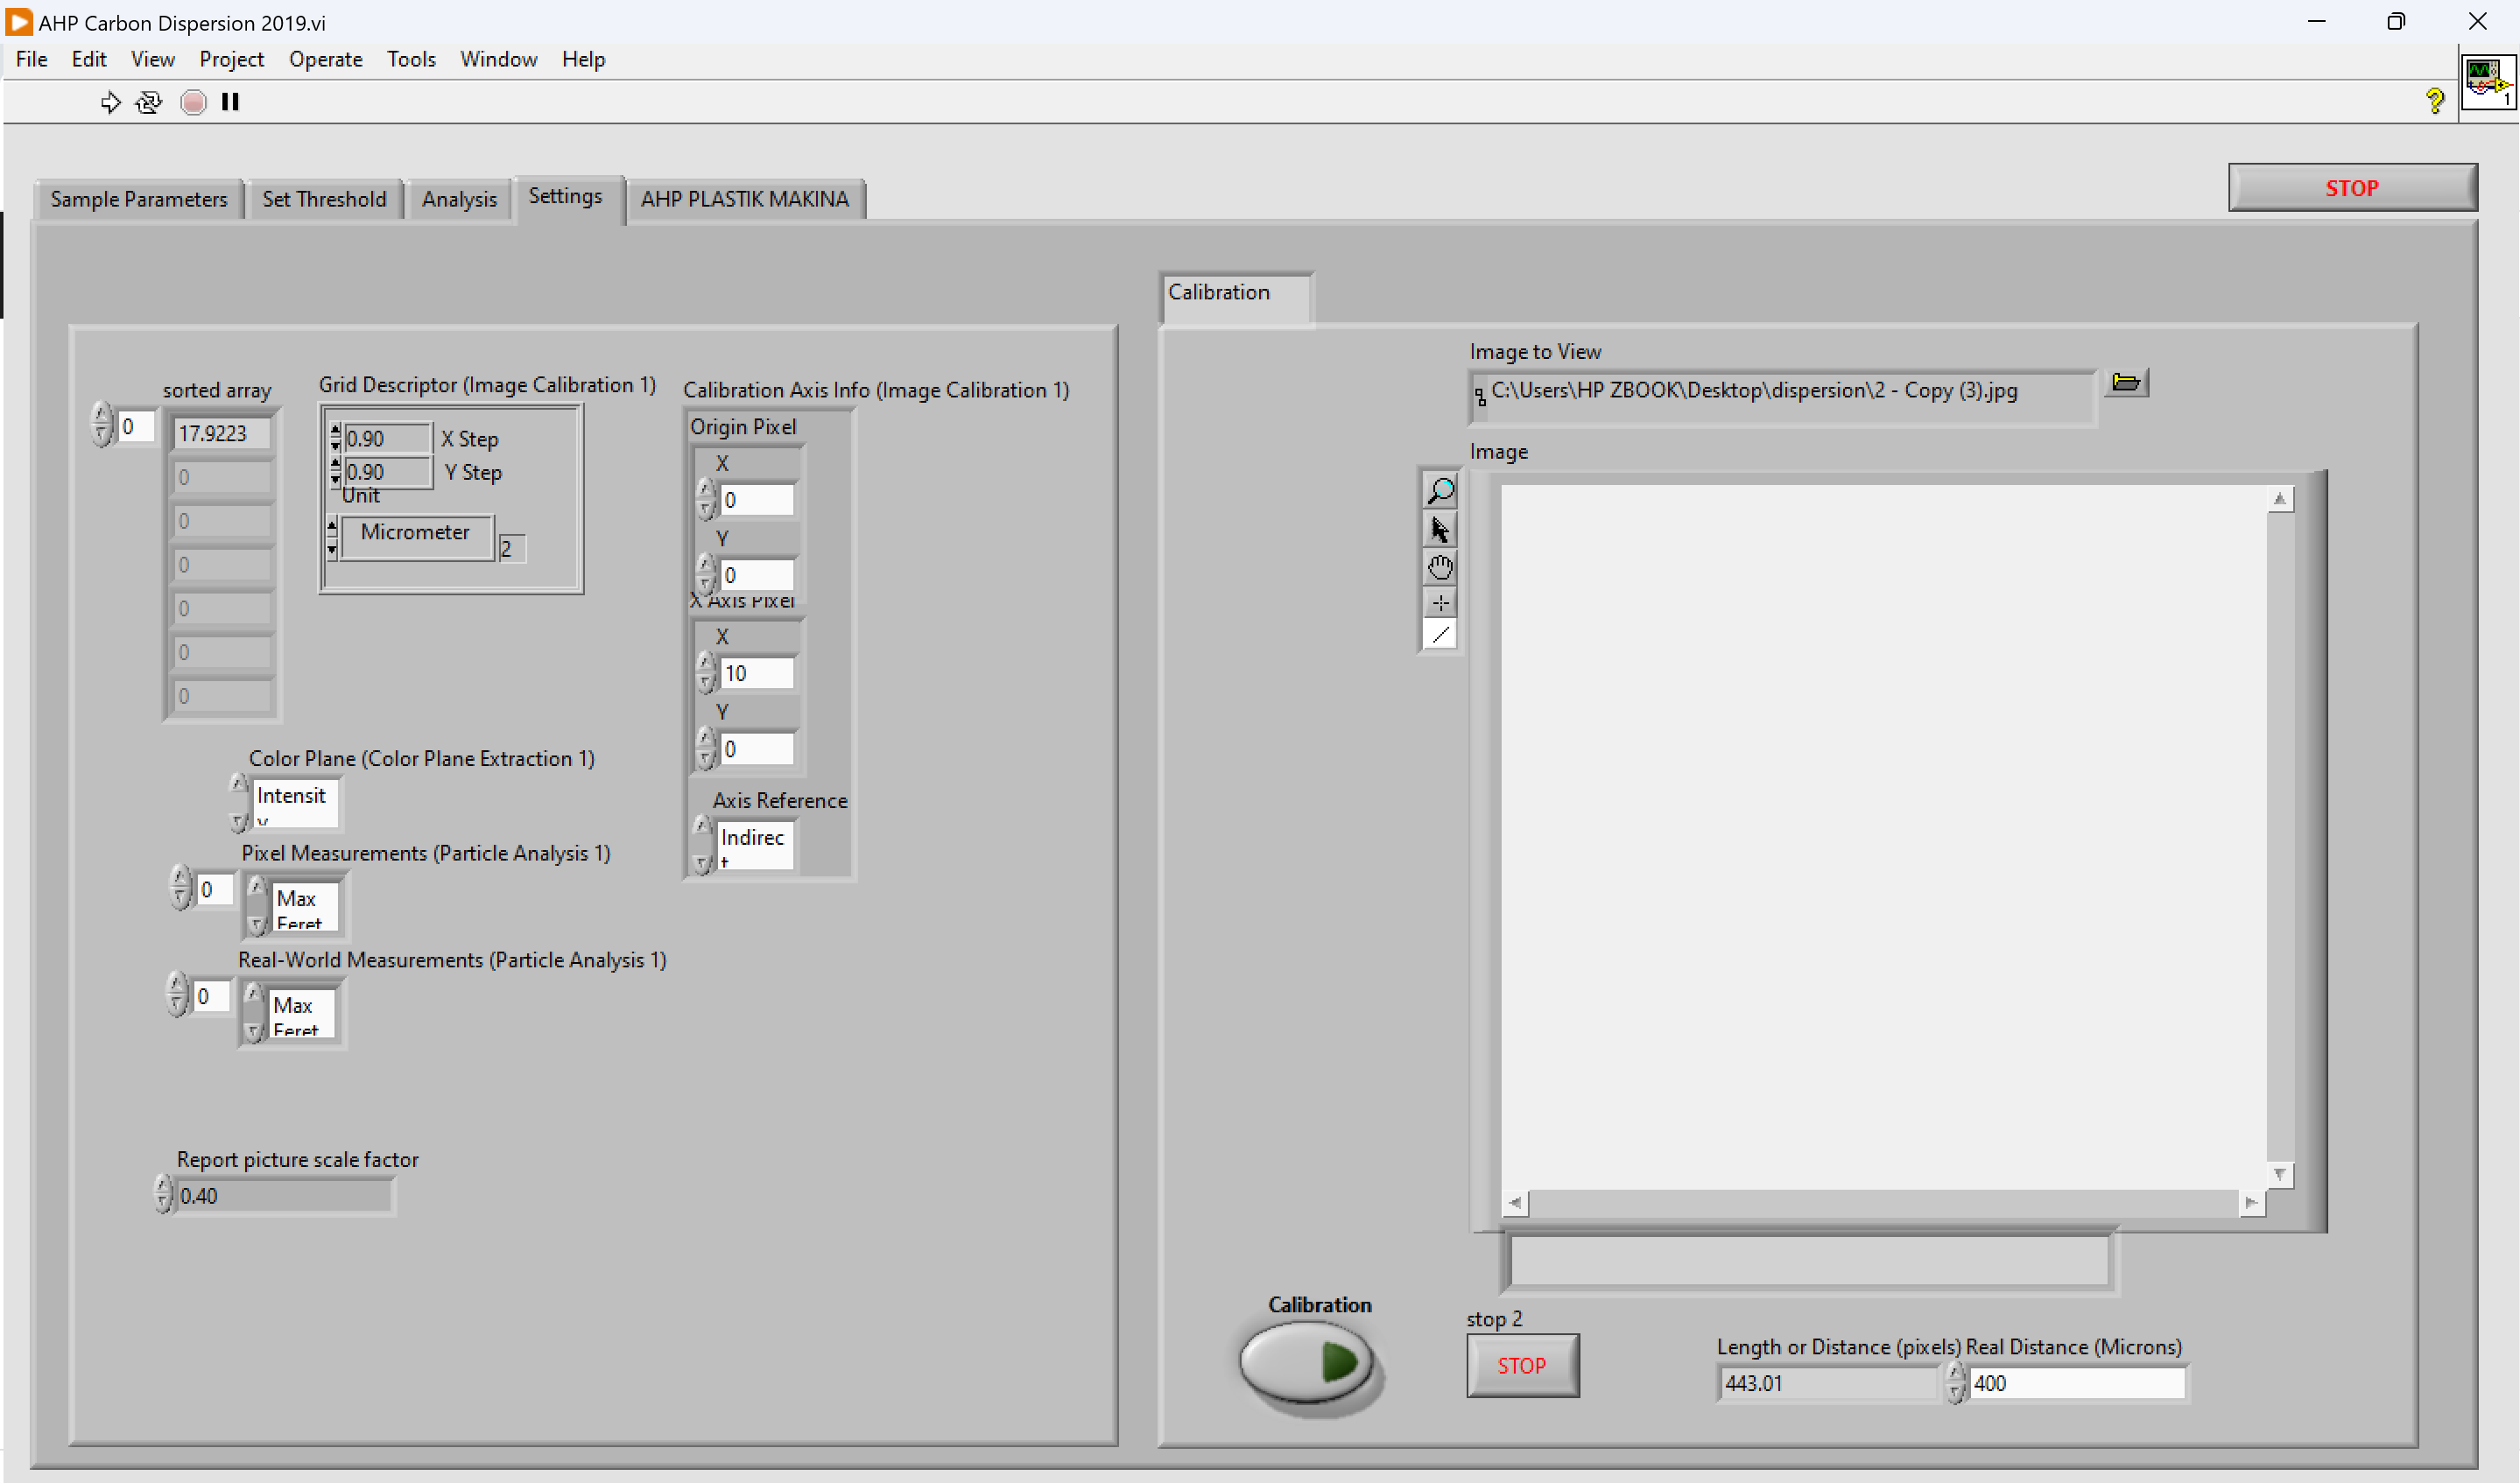
2- Calibrate the microscope 100X pictures (will be done only for first run of machine)
Any microscope from any brands can be used for this test. Software is suitable for all brands.
3- Load 6 captured pictures from samples

4- Analysis will be done automatically according to ISO 18553 (table according to Annex A)
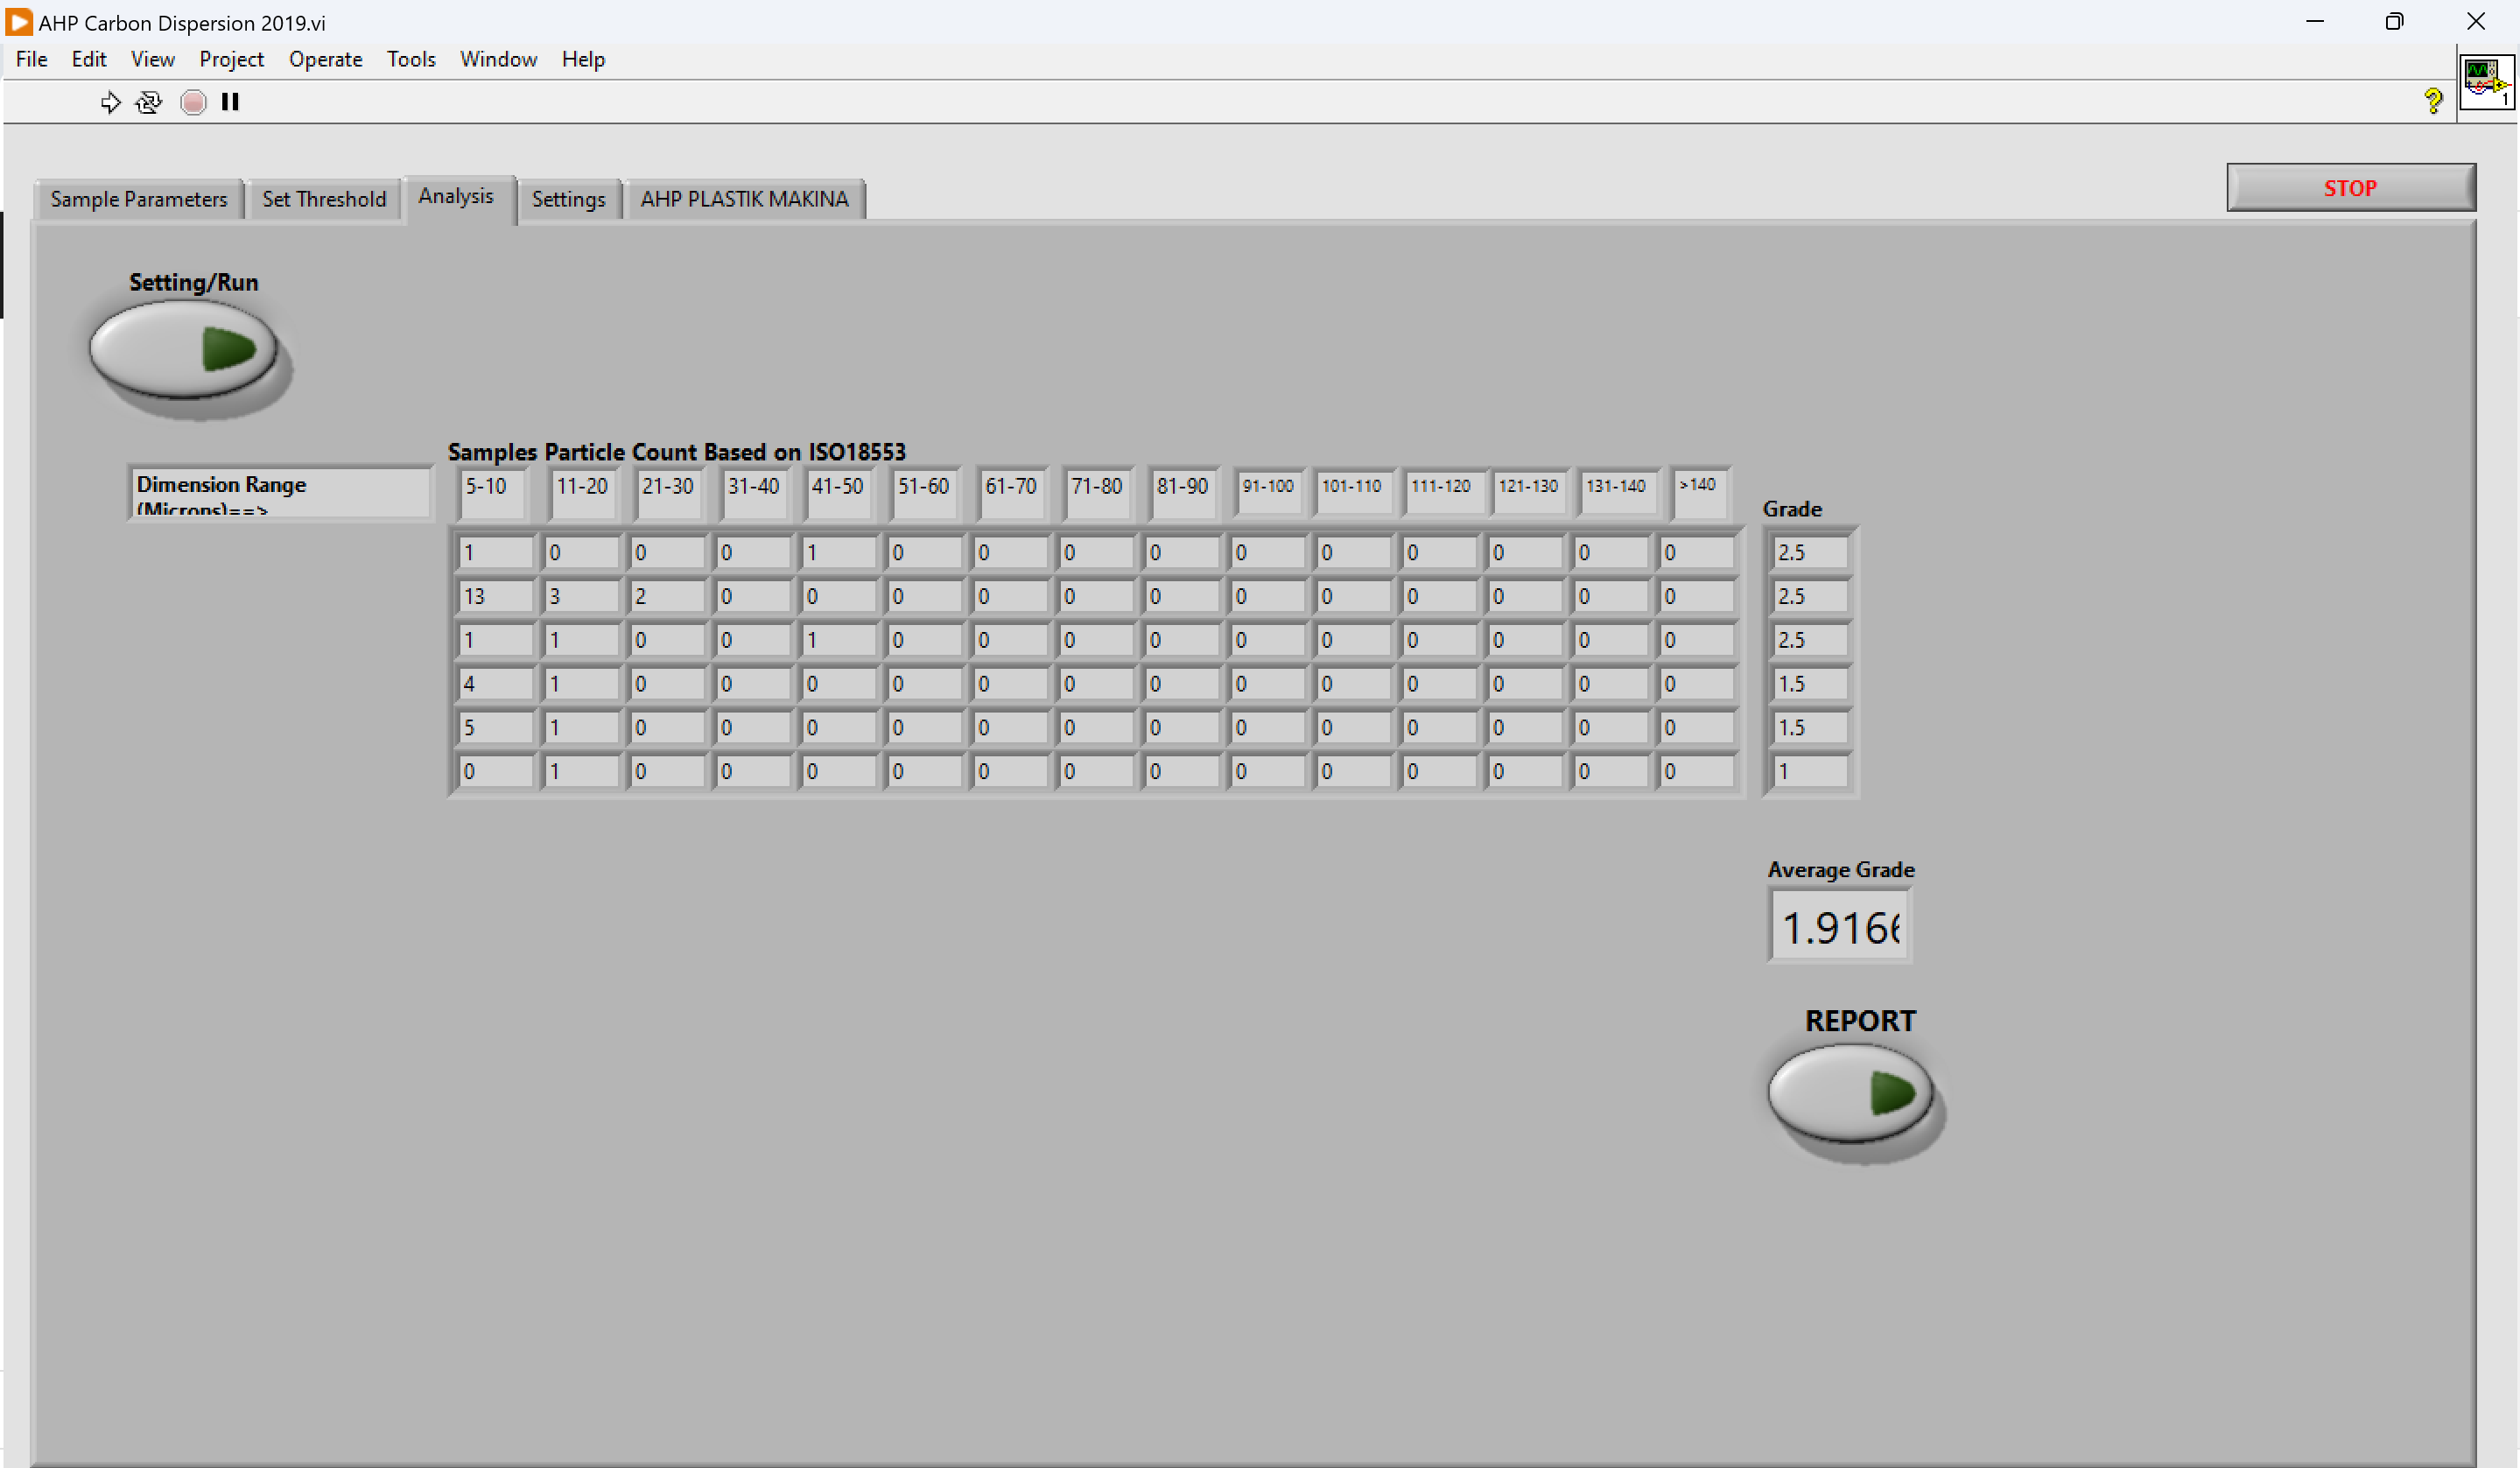
5- At the end will give you a report including original captured pictures and analysis results in single MS-WORD page
6- For any detailed info please contact to our sales.