
6 Apparatus
6.1 Differential Scanning Calorimeter—As a minimum requirement, the thermal analysis equipment shall be capable of measuring heat flow of at least 10 mW full scale. The instrument recorder shall be capable of displaying heat flow or temperature differential on the y-axis and time on the x-axis. The time base must be accurate to 61 % and be readable to 0.1 min.
NOTE 4—The OIT test is a function of a particular compound’s stabilizer system and should not be used as a basis of comparison between formulations that might contain different resins, stabilizers, additive packages, or all of these.
6.2 Gas Selector Switch and Regulators, for high-purity nitrogen and oxygen. The distance between the gas switching point and the instrument cell shall be such that the time required to transition to an oxygen environment is less than 1 min. At a flow rate of 50 mL/min, this equates to a maximum switching volume of less than 50 mL.
6.3 Analytical Balance, 0.1-mg sensitivity.
6.4 Bore Hole Cutter, 6.4-mm diameter.
6.5 Specimen-Encapsulating Press.
6.6 Forceps, Scalpel, and Cutting Board.
6.7 Electronic Mass Flow Controller, Rotometer (Calibrated), or Soap-Film Flowmeter, for gas flow calibration.
6.8 Specimen Holders—Degreased aluminum pans (6.0- to 7.0-mm diameter, 1.5-mm height).
NOTE 5—The material composition of the specimen holder can influence the OIT test result significantly (that is, including any associated catalytic effects).
6.9 Compression-Molding Device with Heated Platens.
6.10 Spacer Plates, Shim Stock, Caul Plates, etc.
6.11 Polyethylene Terephthalate Film (PET) or Polytetrafluoroethylene (PTFE)-Coated Cloth, for sample plaque preparation.
6.12 Thickness Gauge.
6.13 Forced-Air Oven.
9 Sampling
9.1 Sample Selection—Select a test sample, at least 0.1 gr (for example, ~10 mm by ~10 mm for a 1.0-mm geomembrane, or ~7 mm by ~7 mm for a 2.0-mm geomembrane), representing the material to be analyzed. For freshly manufactured and unaged sample, select a region of the product free of contamination, for example, marking or adhesive. For aged coupons, the selected region should also be free of defects and located at least 12 mm away from an edge or a discontinuity, clamping areas, etc.
9.1.1 If the sample contains a layer or layers of polymers other than polyolefins, the polyolefin may be tested separately from the entire cross section. A recommended procedure is given in Appendix X4.
9.2 Homogenization—Homogenization of the test sample is recommended for freshly manufactured and unaged samples, and mandatory for aged samples. One of the procedures given in Appendix X1, Appendix X2, or Appendix X3 can be used to homogenize the test sample after aging. After homogenization, the test sample is compression molded into sheet format (thickness of 0.25 ± 0.015 mm) prior to analysis, using either Practice D4703, Annex A1 (Procedure C) or the procedure presented in Appendix X5.
NOTE 6—The temperature at which molding takes place may be at or above the test temperature of this test method. Prolonged exposure to air at these temperatures may induce a negative bias into OIT measurement. Molding should be performed at as low a temperature and as quickly as possible to minimize this bias.
9.2.1 Testing 5 to 10 mg specimens cut out directly from a product (for example, sampling a geomembrane using a punch) and tested without prior homogenization may be acceptable for monolithic, freshly manufactured, and unaged products, provided that they represent the entire thickness of the product, that is, that there is no over-representation of the skins nor the core on the punched specimen. In case of dispute, results obtained on specimens homogenized and compression molded to a thickness of 0.25 mm are to be considered as referee.
9.2.2 If this test is used to monitor aging of a material, the sample must be homogenized and the same preparation technique must be used before and after aging.
9.3 Number of Specimens—Cut test specimens from the plaque using a 6.3-mm (0.25-in.) bore hole cutter or punch.
9.3.1 When testing a product for specification conformance, that is, on freshly manufactured samples, at least two specimens must be tested.
9.3.2 When evaluating the performance of a material to aging, at least three specimens must be tested before and after aging.
NOTE 7—Excessive difference between individual results may be caused by specimen preparation, for example, from the specimen selection, homogenization, or plaquing process. Should differences between individual specimens be greater than the within-lab repeatability, further investigation could be conducted to assess the significance of each result, which may eventually lead to the exclusion of a result.
10 Procedure
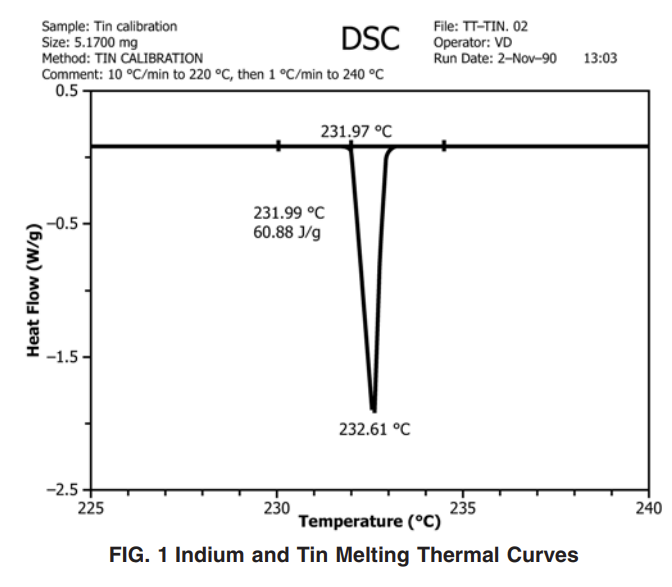
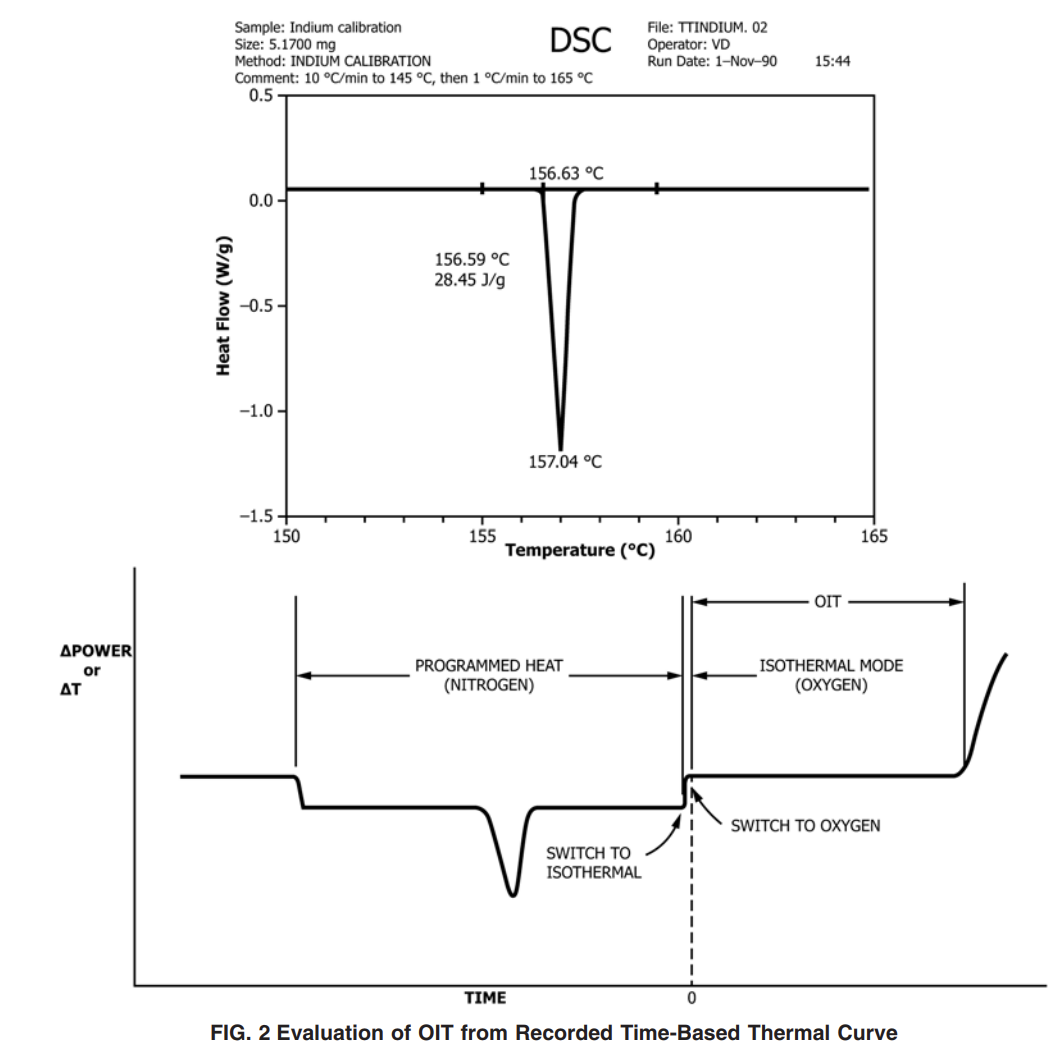
10.1 Instrument Calibration—This procedure uses a two point calibration step. Indium and tin are used as the calibrants since their respective melting points encompass the specified analysis temperature range (180 to 220 °C). Calibrate the instrument in accordance with the manufacturer’s instructions using the following procedure. Calibrate the instrument at least once per month or before use if longer than one month.
10.1.1 Place 5 ± 0.5 mg of indium/tin into an aluminum sample pan. Place an aluminum cover over the pan, and seal using the encapsulating press. Prepare an empty sealed pan to be used as the reference. Place the specimen and reference pans into their respective locations in the instrument cell.
10.1.2 Turn on the nitrogen gas flow at a rate of 50 mL ⁄min (with an absolute pressure of 140 kPa).
10.1.3 Use the following melting profiles:
Indium – ambient to 145 °C at 10 °C ⁄min, 145 to 165 °C at 1 °C ⁄min
Tin – ambient to 220 °C at 10 °C ⁄min, 220 to 240 °C at 1 °C ⁄min
NOTE 8—The specified heating rates are for calibration use only.
10.1.4 Adjust the temperature-calibration software (or potentiometer) to set the melting point at 156.63 and 231.97 °C (see Practice E967) for indium and tin, respectively. The melting point of the calibrant is defined as the intercept of the extended baseline and the extended tangent to the first slope of the endotherm (that is, the onset). See Fig. 1.
NOTE 9—An inadequate melting thermal curve is occasionally obtained due to poor surface contact of the calibrant material to the pan surface. If this occurs, repeat the calibration step. (After one melting/crystallization cycle the calibrant material should coat the bottom of the pan evenly.)
10.2 Instrument Operation:
10.2.1 Load the specimen and reference pans into the cell.
10.2.2 Allow 5 min for a nitrogen pre-purge prior to beginning the heating cycle to eliminate any residual oxygen.
Commence programmed heating of the specimen (under nitrogen flow of 50 ± 5 mL ⁄min) from ambient temperature to 200 °C (set point) at a rate of 20 °C ⁄min.
10.2.3 When the set temperature has been reached, discontinue programmed heating and equilibrate the sample for 5 min at the set temperature. Turn on the recorder. If the instrument being used does not have an isothermal temperature-control mode feature, ensure accurate temperature control by monitoring and adjusting continually, as required.
10.2.4 Once the equilibrium time has expired, change the gas to oxygen at a flow rate of 50 6 mL ⁄min. (Record this event.) This changeover point to oxygen flow is considered the zero time of the experiment.
10.2.5 Continue isothermal operation until the maximum exotherm has been reached to allow a complete examination of the entire exotherm (see Figs. 2 and 3). At the tester’s discretion, it is acceptable to terminate the test at a predetermined heat flow change provided that data are available to support the alternative. It is also acceptable to terminate the test if time requirements stated in the product’s specification have been met.
10.2.6 Upon completion of the test, switch the gas selector
back to nitrogen and cool the instrument to ambient temperature. If additional testing is being conducted, cooling the instrument cell below 60 to 70 °C is sufficient to avoid any premature thermal oxidation of the sample.
10.2.7 Clean the DSC cell of contamination by heating to 500 °C for 5 min in air (or oxygen) prior to conducting measurements and between the testing of different formulations.
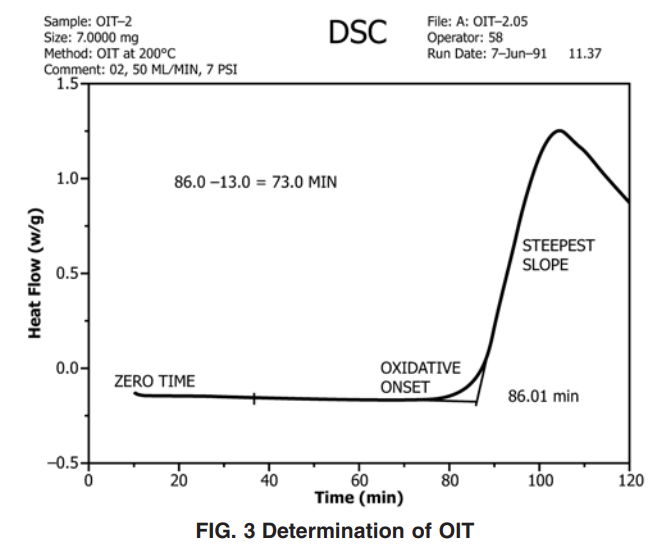
10.3 Thermal Curve Analysis—The data is plotted with the heat-flow signal normalized to sample mass (that is, W/g) on the y-axis, versus time on the x-axis. Expand the x-axis as much as possible to facilitate analysis.
10.3.1 Extend the recorded baseline beyond the oxidative reactive exotherm. Extrapolate the steepest linear slope of this exotherm to intercept the extended baseline (see Fig. 3).
10.3.2 The OIT is measured to within ±0.1 min from zero time to the intercept point.
10.3.3 The tangent method used to measure the oxidation time is the preferred method, but the selection of the appropriate tangent to the exotherm sloped line is, at times, difficult if the exothermic peak has a leading edge. It is possible that exothermic peaks with leading edges occur if the oxidation reaction is slow.
NOTE 10—The oxidation may not occur as a smooth transition and multiple steps or slopes may be produced. When this occurs, resampling and retesting are recommended. Use of one of the homogenization methods mentioned in the appendixes of this standard may be used to obtain a homogeneous specimen and a single exothermic peak.
NOTE 11—If multiple slopes result from the oxidation process, OIT needs to be defined to accurately reflect the oxidation of the polymer. It is up to the user to determine which slope best represents the material property for an application. It must be noted in the report if the tangent line is not drawn from the first steep slope.
NOTE 12—If the selection of the appropriate baseline is not obvious using the tangent method, try the offset method. Draw a second baseline parallel to the first baseline at a distance of 0.05 W ⁄g above the first baseline. The intersection of this second line with the exotherm signal is defined as the onset of oxidation. The time from this intersection to zero time is the OIT.
NOTE 13—Other gas flow rates or specimen weights, or both, may be used if shown to be equivalent.