

How to Set Parameters of OIT Tester
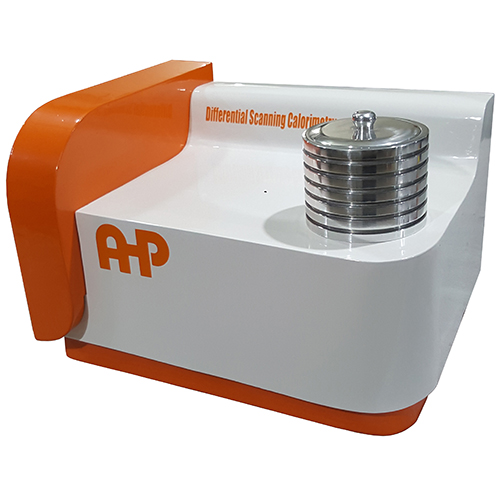
After installation of driver:
And installation of the software:
Main panel of software has 4 pages:

First of all set the parameters for OIT test as below (got to “parameters Tab”):
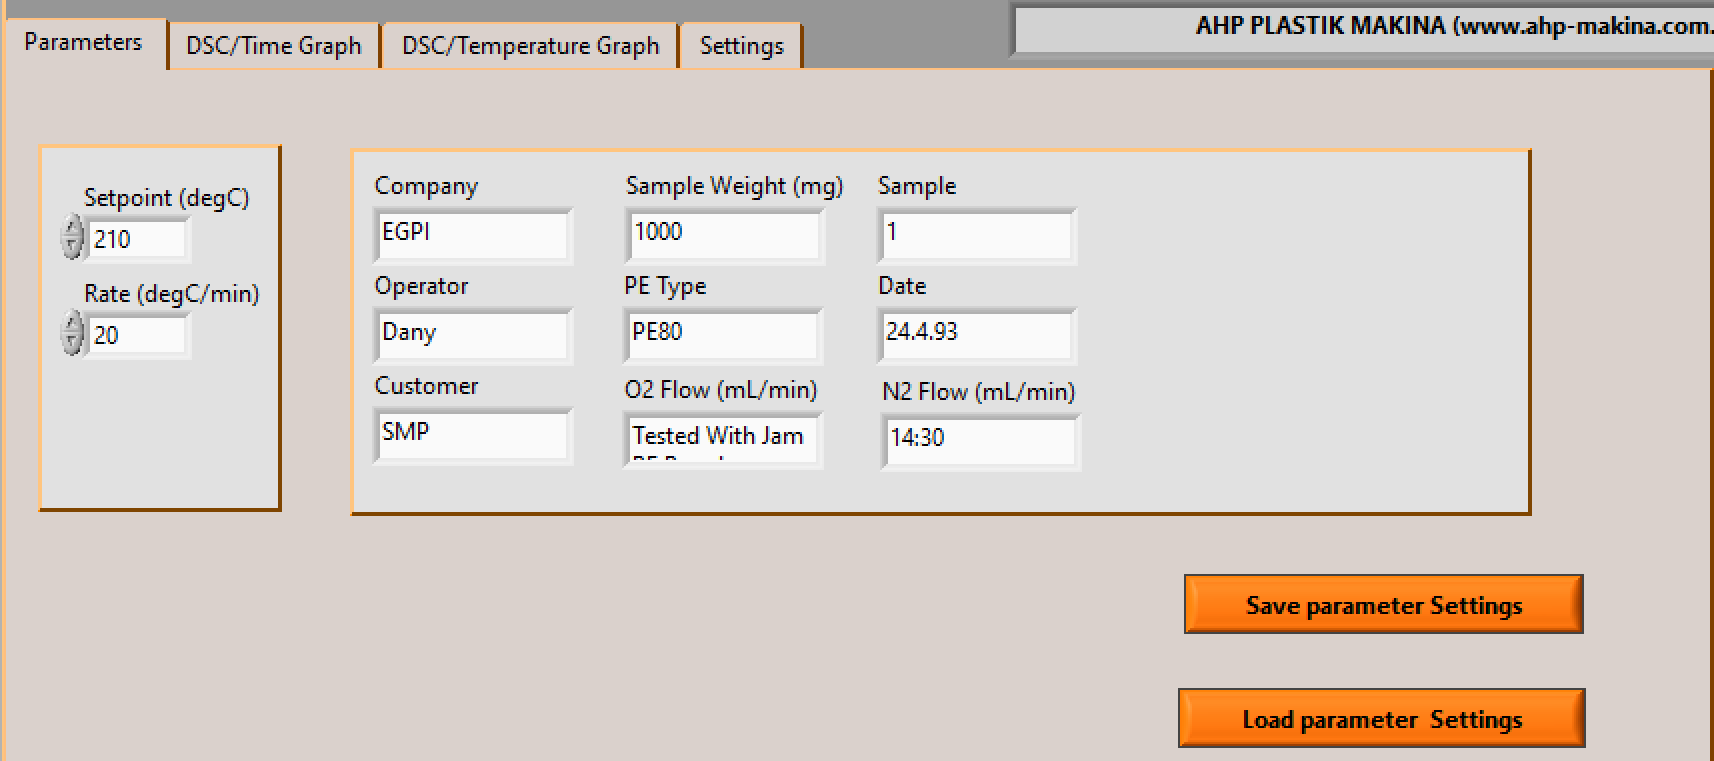
For OIT measurement you need to set two main parameters of “Setpoint(degC)” and “Rate(degC/min)”.
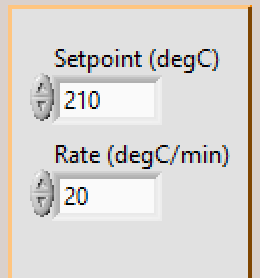
For example for PE OIT measurement temperature is 200C or 210C and rate is 20. Then you have settings for general parameters of the sample as below:
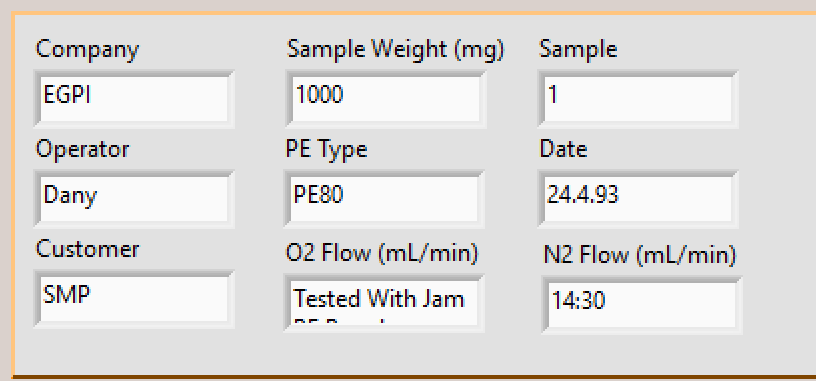
you can also save these general settings as “.txt” file and then load it when needed. Don’t forget to add .txt at the end of file name.
Next page is DSC-Time graph.
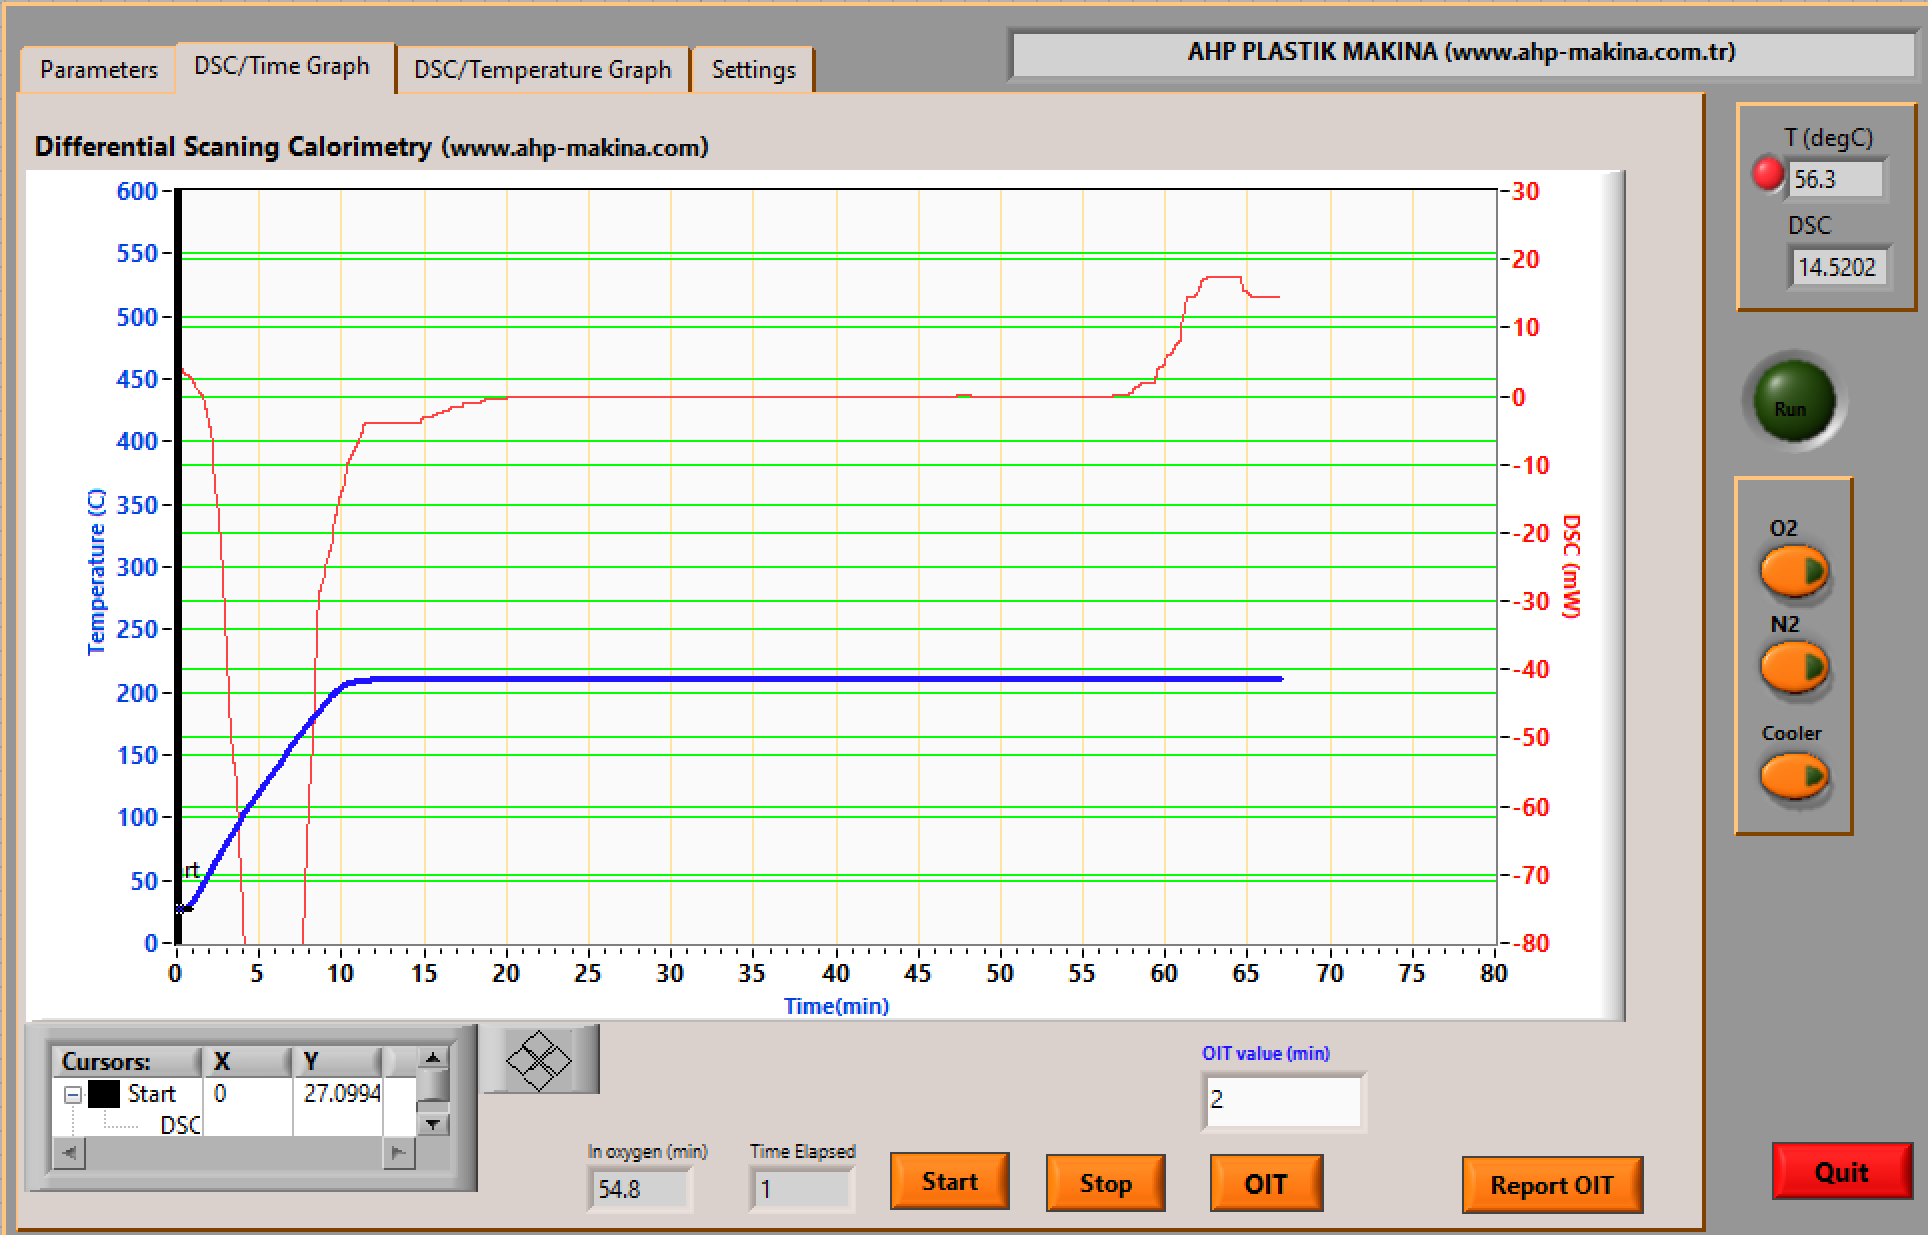
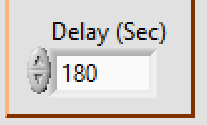
After setting the parameters in the first page now you can start the test. Click on “Start”. When you click start you will hear sound of solenoid valve for N2 gas. It will be opened automatically after clicking on Start. When the temperature reaches set value, a timer will be start counting. This is the timer that after passing this time N2 gas will be switched automatically to O2 gas. This time can be set in setting page with the name of “Delay(Sec)”.
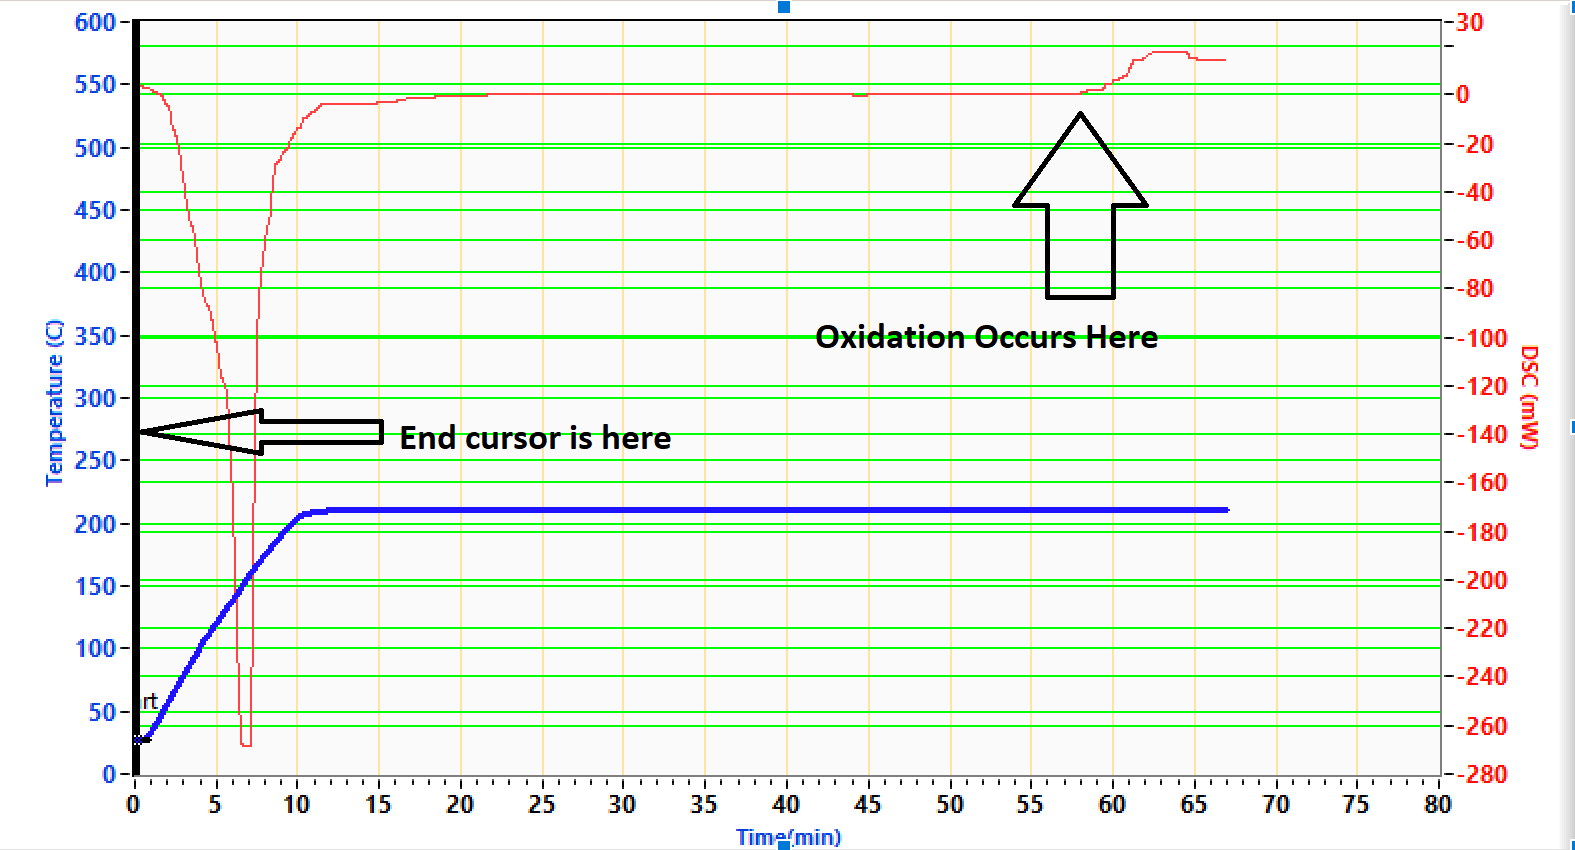
When this delay time passes , N2 gas will be switched to O2 gas. Then DSC graph line will be continue as straight line till breakage occurs in this graph upward. This is where the oxidation occurs in the sample.
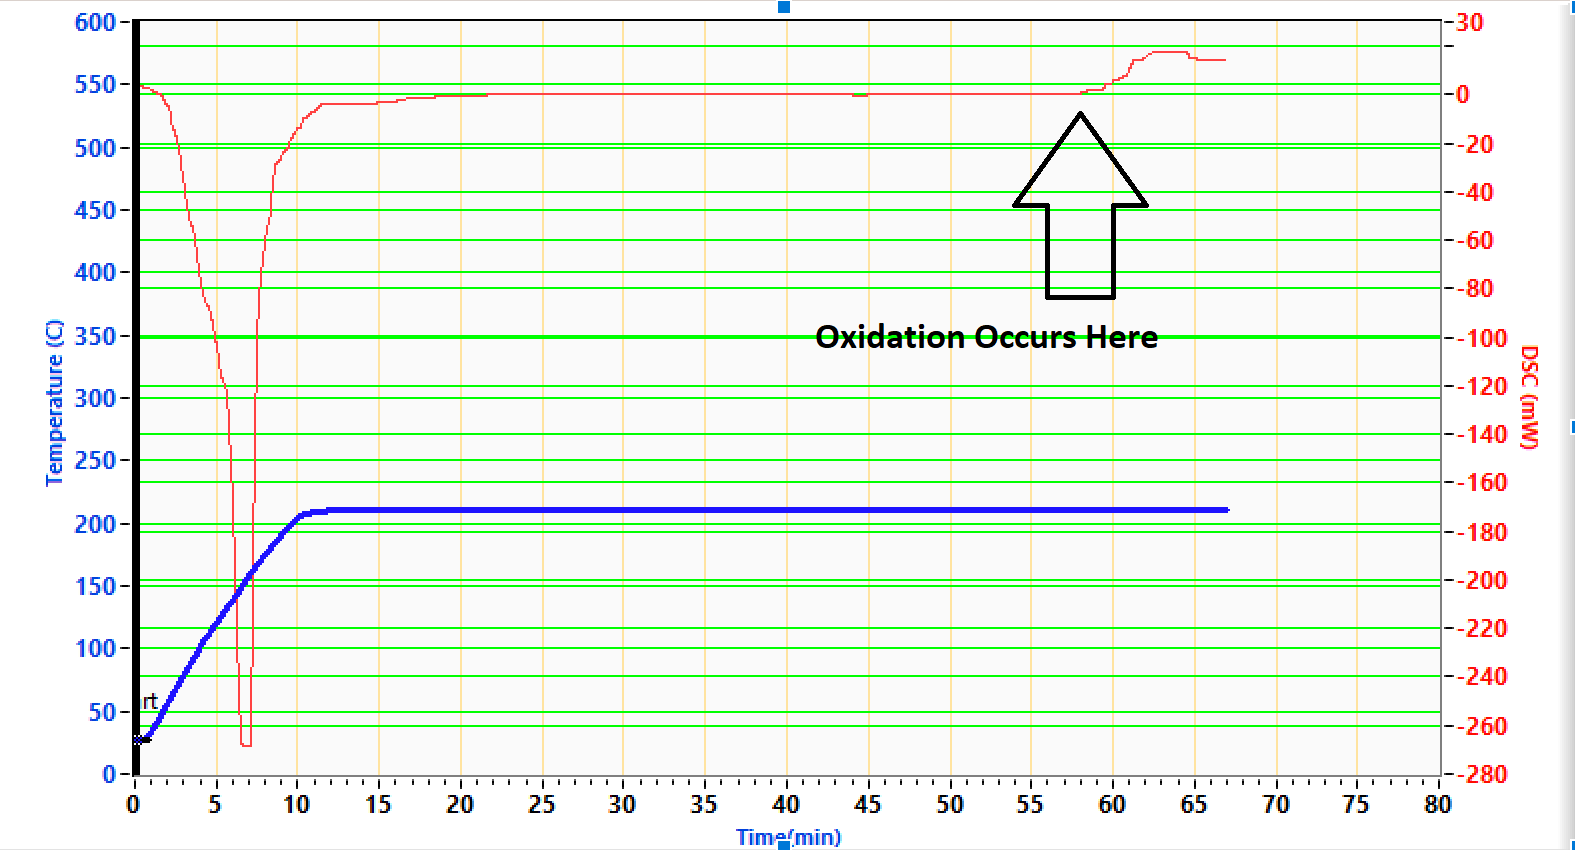
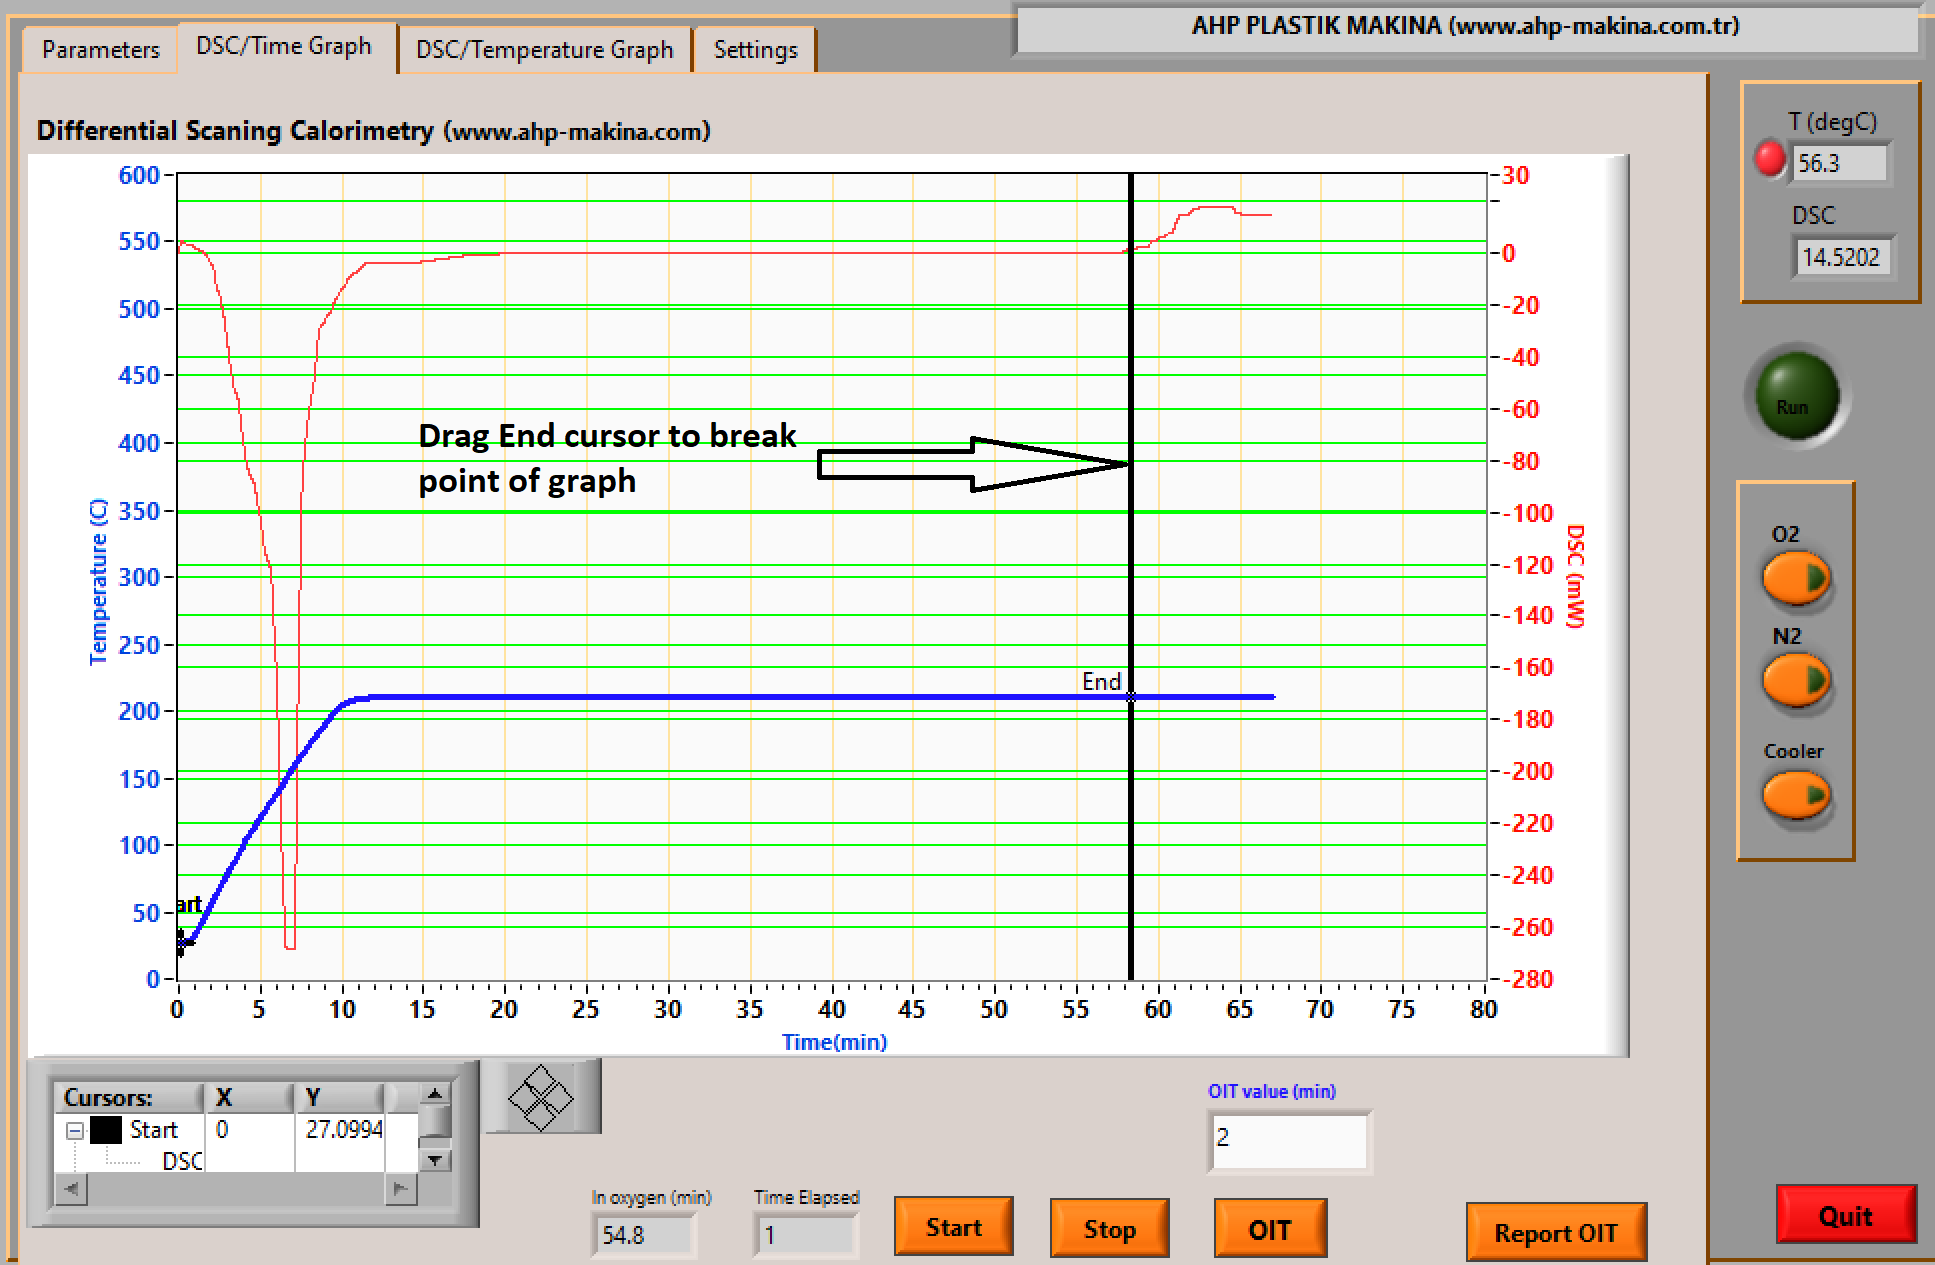
After oxidation occurs “Stop” the test and drag the “End” cursor to the break point. This process can be automatically done when you export data to “Advantage” software. After you dragged end cursor to break point click on “OIT” key and oxidation time will be calculated.
End cursor is shown in the picture below:
Drag end cursor as below graph:
After OIT is calculated you can click on “Report” key to have report in MS WORD. you need to have MS WORD installed in the PC.
Above steps are easy steps to have OIT measurement. When you have clicked on “Report OIT” and table data is not filled in the report you need to open the security to the software folder as below guide:
Go to “C:\program files” find the folder of “AHP DSC TA” right click on it:
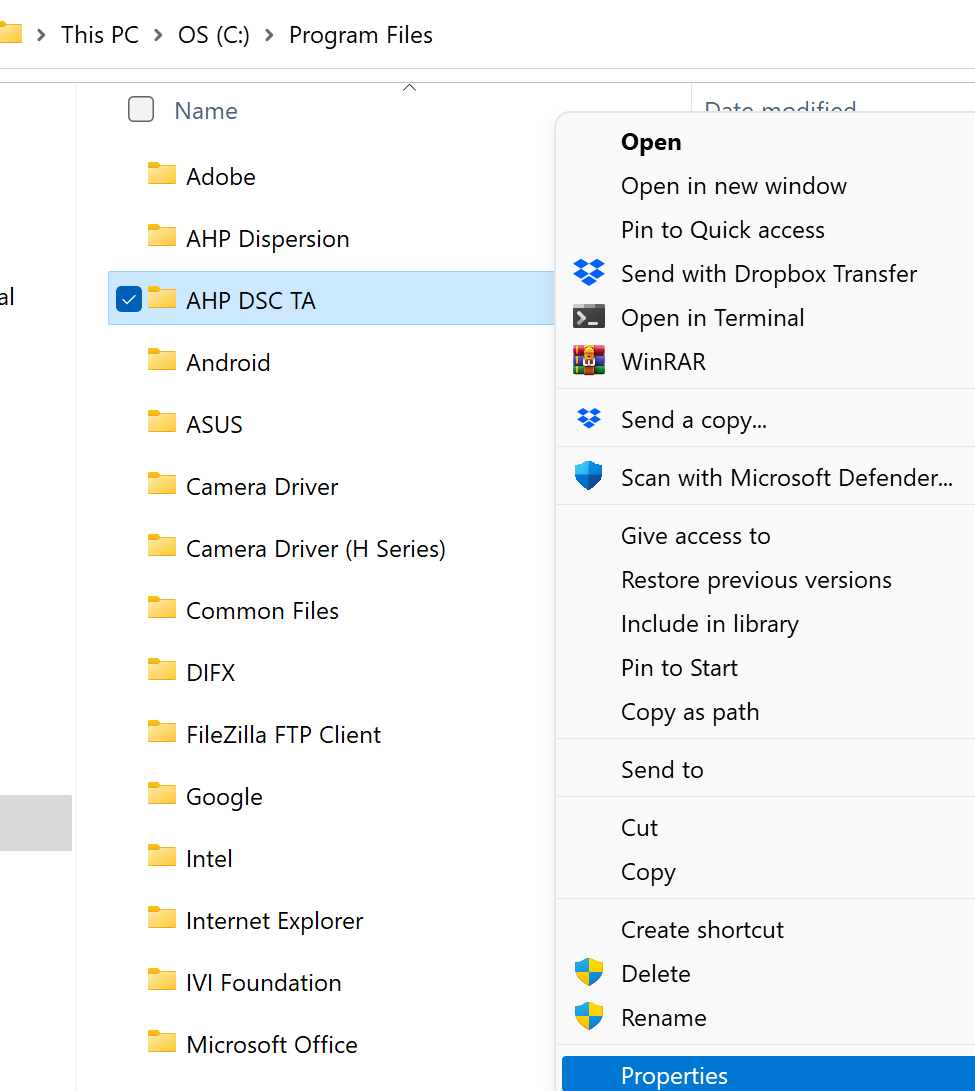
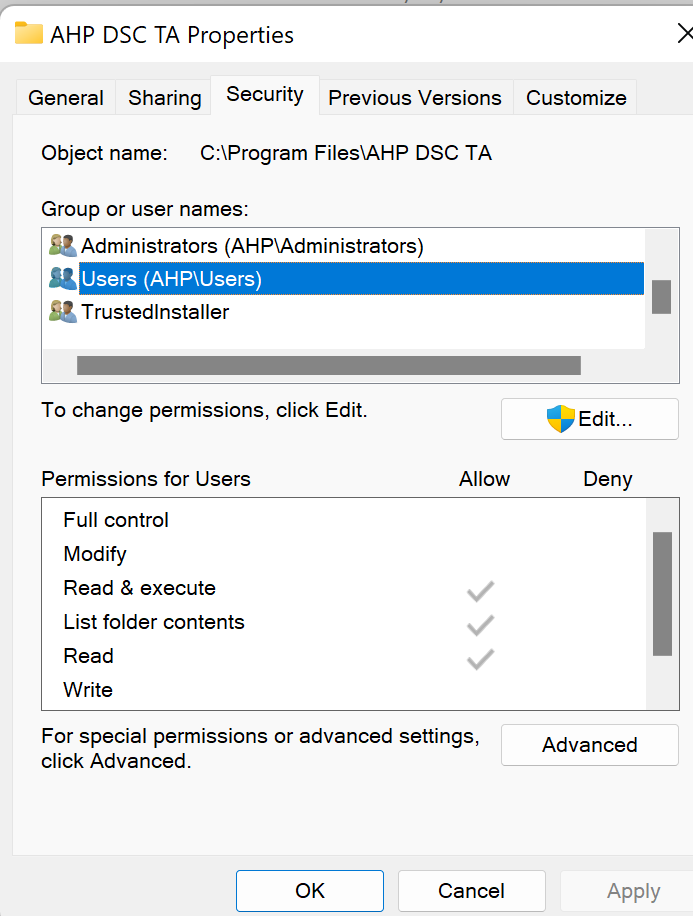
Click on “Users (….)” on “Group or user names” then click on “Edit”:

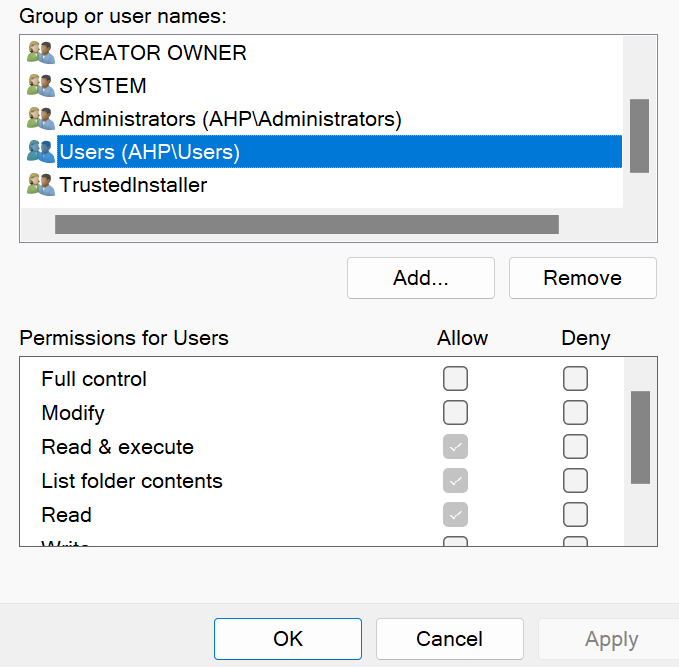
Again click on “Users (…..)” and then in the “Permissions for users” in front of “Full control” click on “Allow”. In this way when you click on “Report OIT” in the software the table data on the template in report file will be filled automatically. This is only very easy way to measure OIT of materials. Other functions of the software is in other posts in “Info Center” of the website.
Export of data to be analyzed in advantage software
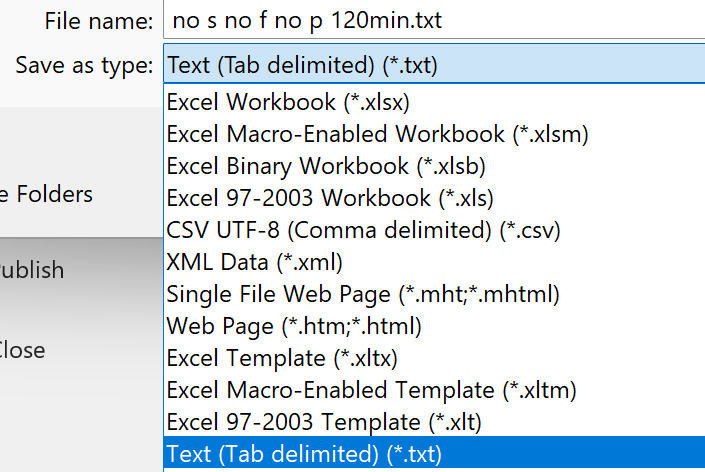
When you are doing material analysis or doing melting point analysis and need to analyze DSC-Temp graph data you need to export data to “Advantage” software. For this purpose after finishing data logging in the software stop it and click on “Export to TA”. Then wait for all data to be opened in MS EXCEL and save theses data as “Text(tab delimited)”. now you can open this data in “Advantage” software for analysis of Tg, Melting point, peak, integral analysis, ….
Checking of Tin and Ind Melting Point for Calibration checkout
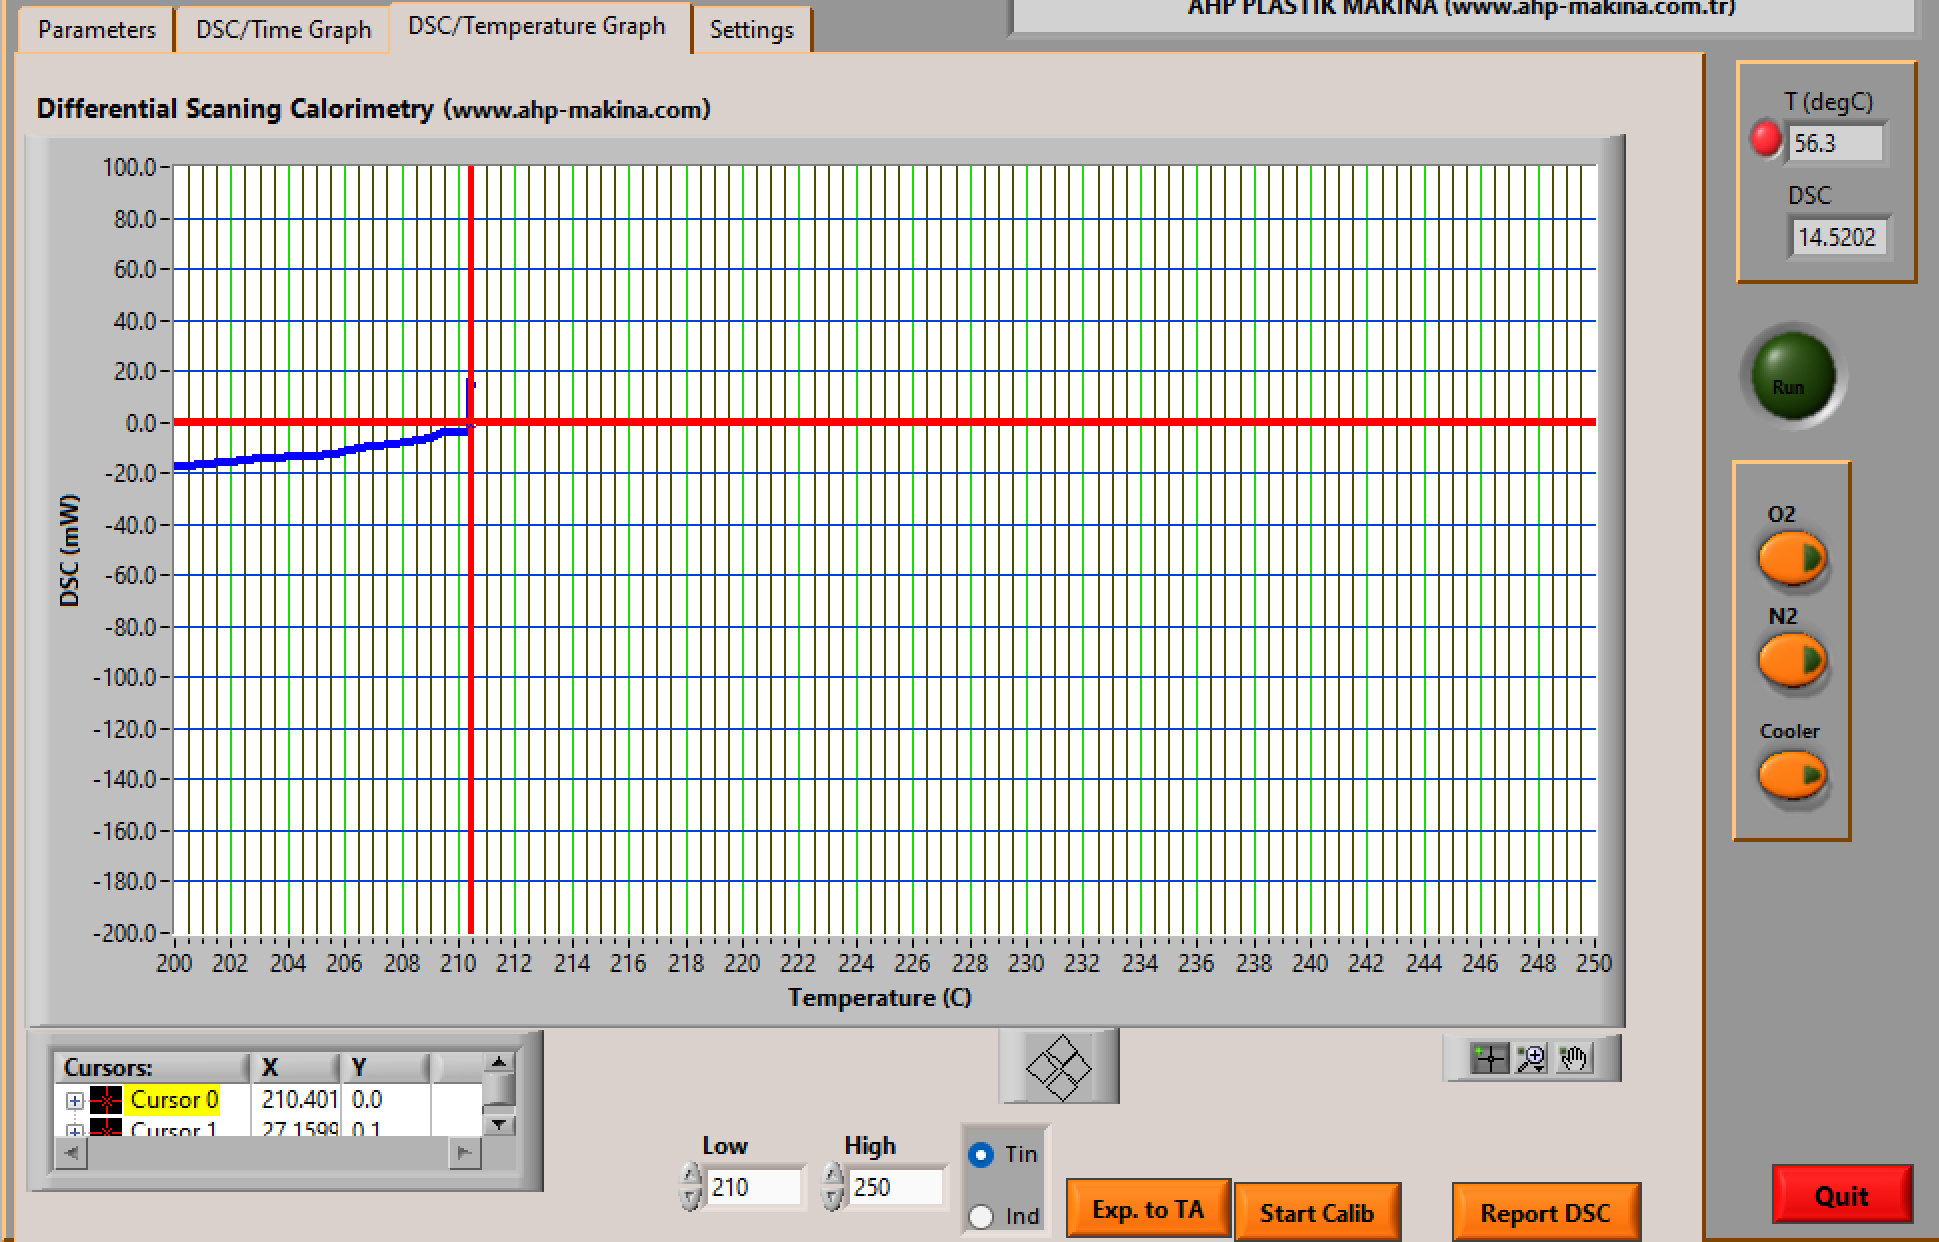
Prepare sample of Tin or Ind based on working temperature needed. Melting point of Ind is 156.6C and Tin is 231.9C. After sample prepared put sample to left sensor and empty pan to right sensor and close the lid. Select Tin or Ind in the DSC-Temp page:
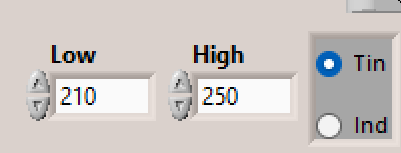
Then based on this selection, the range for 1C/min rate of software as per standard will be chosen automatically. now yo can click on “Start Calib”. between Low and High the temperature increase rate will be automatically set to 1C/min as per standard.
when you are testing Tin , set the temperature to 240 and when doing test on Ind set the temperature to 210C. After set temperature reached you can click “stop” and the click “Export to TA”.
wait for data to be opened in MS EXCEL and then save as “Text (tab delimited)”.
How to Set Parameters of HPOIT Tester
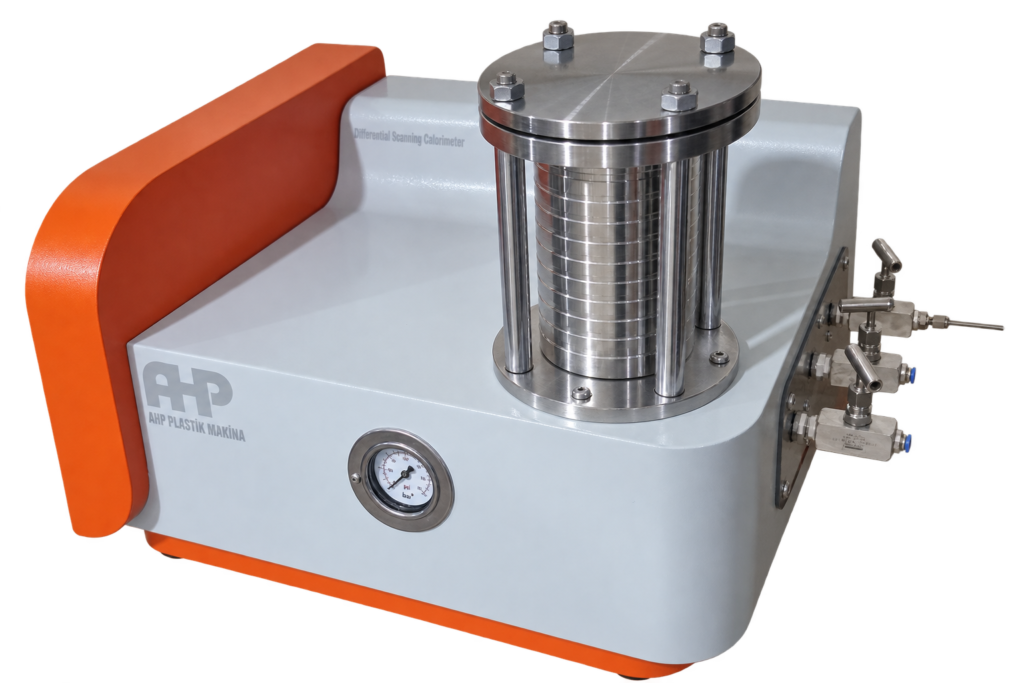
Installation of the software is like above instruction for standard OIT tester. the settings of the software will be as below instruction.
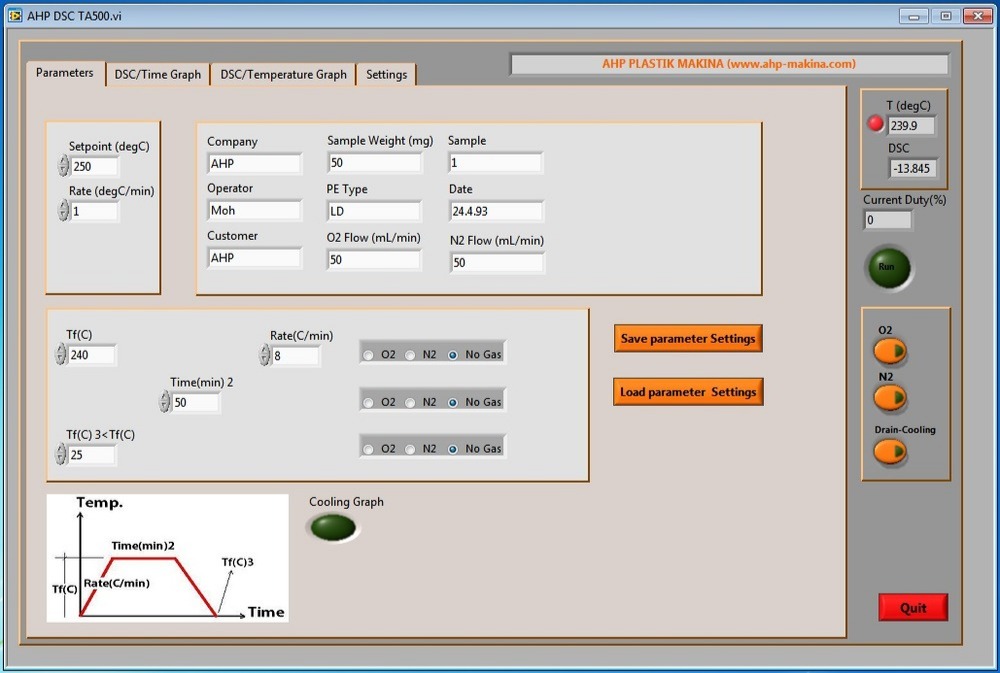
DSC Software – Parameters Page Operating Instructions
The Parameters page is used to enter the test information, define the DSC temperature program, select the purge gas, and start or stop a measurement. The page also displays the current furnace temperature and DSC signal.
1. Sample and Test Information
Before starting a test, enter the required information in the corresponding fields:
- Company: Enter the company or laboratory name.
- Operator: Enter the name or initials of the person performing the test.
- Customer: Enter the customer or project name, if applicable.
- Sample Weight (mg): Enter the mass of the sample in milligrams.
- PE Type: Enter the material type or grade.
- Sample: Enter the sample identification number or name.
- Date: Enter the test date.
- O2 Flow (mL/min): Enter the required oxygen flow rate. This value will be printed on the report file.
- N2 Flow (mL/min): Enter the required nitrogen flow rate. This value will be printed on the report file.
These sample-data and gas-flow fields are provided directly on the Parameters screen.
2. Current Heating Program
The Currentl heating conditions will be shown here:
- Setpoint (°C): Current setpoint according to temperature/time program
- Rate (°C/min): Current rate according to temperature/time program
The instrument will increase the temperature according to the selected heating rate until the programmed setpoint is reached.
3. Temperature / Time Program
The lower section of the page is used to define the subsequent stages of the test.
Tf (°C)
Enter the final temperature of the programmed stage.
Rate (°C/min)
Enter the required heating or cooling rate for that stage.
Time (min)
Enter the time for which the sample will remain at the specified temperature.
Tf (°C) 3
Enter the final temperature for the third programmed stage.
The diagram at the bottom-left of the screen provides a graphical representation of the programmed temperature-versus-time sequence.
4. Gas Selection
For each programmable stage, select the required atmosphere:
- O2: Oxygen purge.
- N2: Nitrogen purge.
- No Gas: No purge gas is selected.
Make sure the appropriate gas supply is connected and the required flow rate has been set before starting the test.
5. Saving and Loading Parameters
Use Save parameter Settings to save the currently entered test parameters for future use. for the file name you need to add “.txt” at the end of file name.
Use Load parameter Settings to recall previously saved parameters. Verify all loaded values before starting a new measurement.
6. Starting the Test
After confirming the sample information, temperature program, gas selection, and flow settings, click the green Run button.
During operation, the right-hand status panel displays:
- T (degC): Current measured temperature.
- DSC: Current DSC signal/value.
- Current Duty (%): Current heater-control output.
These monitoring indicators are visible on the software interface.
Important: Before pressing Run, verify the sample weight, temperature limits, heating/cooling rates, purge-gas selection, and gas flow rates. Incorrect parameters can produce invalid test results or cause the test to operate outside the intended method.
7. Gas and Cooling Controls
The controls on the right side of the screen provide manual status/control for:
- O2
- N2
- Drain-Cooling
The corresponding indicator shows the operating status of each function. Also you can use these buttons for manual control of solenoid valves for gases and Drain/Cooling.
8. Viewing Test Graphs
During or after the test, use the tabs at the top of the software:
- DSC/Time Graph: Displays DSC signal versus time.
- DSC/Temperature Graph: Displays DSC signal versus temperature.
- Parameters: Returns to the test-programming page.
- Settings: Opens the software configuration page.
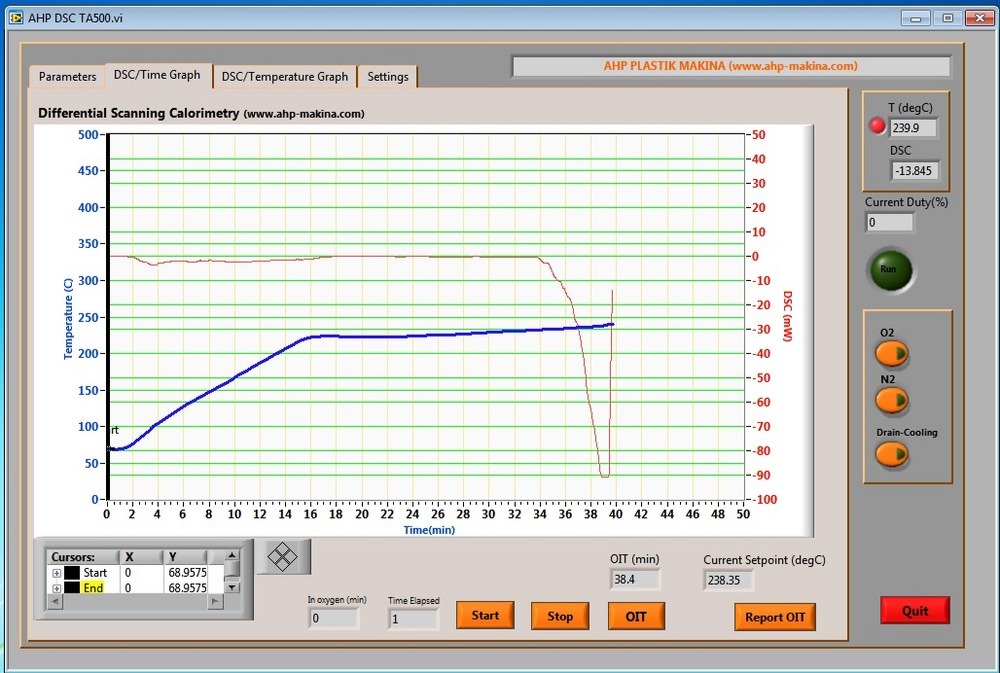
DSC Software – DSC/Time Graph Page Instructions
The DSC/Time Graph page is used to monitor the test curves in real time and to determine the Oxidation Induction Time (OIT) from the recorded DSC data.
1. Understanding the Graph
The main graph displays the test results as a function of time:
- X-axis – Time (min): Shows the elapsed test time.
- Left Y-axis – Temperature (°C): Displays the sample/furnace temperature curve.
- Right Y-axis – DSC (mW): Displays the DSC signal.
The temperature and DSC curves are plotted simultaneously so that changes in the DSC signal can be compared directly with the temperature program.
2. Graph Cursors
The Cursors panel below the graph contains Start and End cursors.
These cursors are used to select the relevant points on the DSC curve when determining the oxidation induction time.
The X and Y columns show the coordinates of the selected cursor positions.
Move the cursors to the required positions on the graph according to the OIT calculation method being used.
3. In Oxygen (min)
The In oxygen (min) field indicates the time associated with the start of the oxygen stage. When using the machine in standard low pressure OIT measurement mode.
This value is used as a reference point when calculating the oxidation induction time. In standard pressure OIt measurement, when temperature reaches the set point and time of delay passed, N2 gas will automatically changes to O2 gas and the graph will be marked with “Start” label and also this “in Oxygen(min)” counter will start counting up.
4. Time Elapsed
The Time Elapsed field shows the elapsed test time during measurement.
This allows the operator to follow the progress of the current test without reading the graph directly.
5. Start and Stop
Use Start to begin recording/displaying the measurement on the DSC/Time graph.
Use Stop to stop the current graph measurement or data-recording sequence.
6. OIT Calculation
After the required portion of the DSC curve has been recorded:
- Position the graph END cursor at the appropriate reference points. and Click on Calculate to measure the OIT Value.
- Confirm the oxygen introduction point. This point will be automatically marked on the graph when you are using as standard pressure mode. And in high pressure mode, the start of Oxygen is the start point of the graph.
- Click OIT to calculate the oxidation induction time.
- The calculated result is displayed in the OIT (min) field.
The OIT value represents the time interval between the defined oxygen-reference point and the detected oxidation point according to the software calculation.
7. Current Setpoint (°C)
The Current Setpoint (degC) field displays the temperature setpoint currently being used by the temperature-control program.
This is useful for confirming that the system has reached or is maintaining the required OIT test temperature.
8. OIT Report
Click Report OIT after the OIT calculation has been completed to generate the OIT test report.
Before generating the report, verify that:
- the correct test data is displayed;
- the cursor positions are correct;
- the oxygen reference point is correct; and
- the calculated OIT (min) value is reasonable for the test.
Note: The accuracy of the OIT result depends on correct identification of the oxygen introduction point and the oxidation onset/reference point on the DSC curve.
For the reporting, you need to have MS WORD installed on the computer.
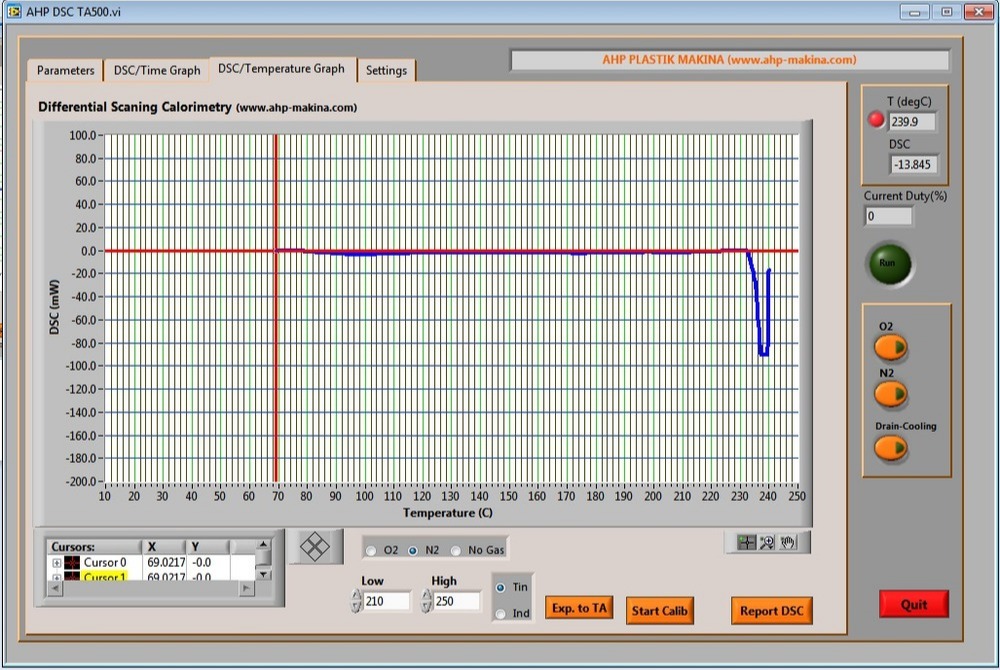
DSC Software – DSC/Temperature Graph Page Instructions
The DSC/Temperature Graph page is used to evaluate the DSC signal as a function of temperature, perform temperature calibration, and prepare DSC results for reporting.
1. DSC/Temperature Graph
The main graph displays:
- X-axis – Temperature (°C): The measured temperature range.
- Y-axis – DSC (mW): The DSC heat-flow signal.
Thermal events such as melting peaks can be observed directly on this graph.
2. Cursor Function
The Cursor control below the graph allows a specific point on the DSC curve to be selected.
The corresponding:
- X value indicates the temperature at the selected point.
- Y value indicates the DSC signal at that point.
The cursor can be moved along the curve to examine the position and magnitude of thermal events.
3. Low and High Temperature Range
Use the Low and High fields to define the temperature range used for evaluation or calibration. This low and high value is the range in which the rate of temperature increase will be 1C/min according to the standard for verification of the temperature using reference materials like Tin and Ind. For example when we are using Tin for temperature verification, the expected melting point is 231.9 C then Low value will be 20 C lower than this and High value will be 20 C higher than this. When you select Tin and click on “Start Calib” these low and high values will be automatically set.
- Low: Lower temperature limit.
- High: Upper temperature limit.
4. Calibration Material Selection
Select the appropriate reference material before performing temperature calibration:
- Tin: Select when a tin reference standard is used.
- Ind: Select when an indium reference standard is used.
The selected reference must correspond to the actual calibration material placed in the DSC. Selection of this material will change “Low” and “High” value range that is the range of the temperature increase rate of 1 C/min for accurate melting point measurement.
5. Start Calibration
Click Start Calib to initiate the temperature verification procedure using the selected reference material and temperature range.
The calibration peak should be clearly visible and suitable for determining the reference transition temperature. This can be done on the software it self or using exporting of data to “Universal Analysis” software.
6. Export to TA
Click Exp. to TA to export the DSC measurement data for further analysis in other thermal-analysis software like “Universal Analysis”.
Use this function when additional processing or evaluation of the recorded DSC curve is required outside the AHP DSC software.
7. DSC Report
Click Report DSC to generate the DSC-Temp test report from the recorded measurement.
Before generating the report, confirm that the required thermal event is clearly recorded and that the appropriate measurement/calibration data has been selected.
Important: For temperature calibration, use a suitable certified reference material and ensure that the selected Tin or Ind option corresponds to the reference actually being tested.
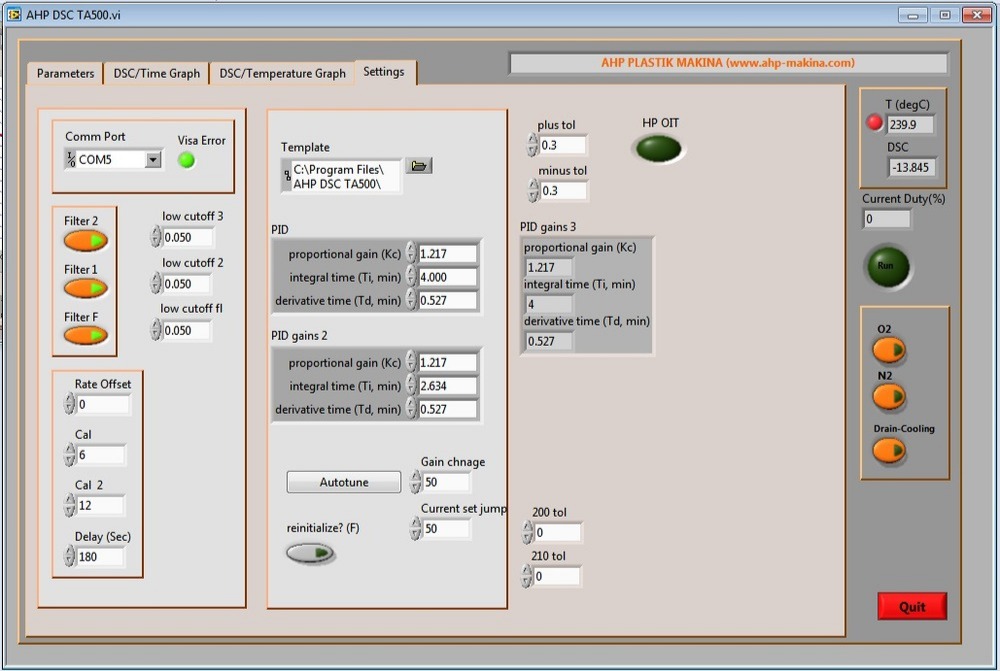
DSC Software – Settings Page Instructions
The Settings page is used for communication setup, signal filtering, calibration parameters, PID temperature-control tuning, and OIT-related control tolerances. These settings are generally configuration parameters and should only be changed when adjustment or calibration is required.
1. Communication Port
Use Comm Port to select the serial communication port used between the DSC instrument and the computer.
The Visa Error indicator shows the communication status:
- A normal/green indication means communication is operating correctly.
- If an error is indicated, verify the selected COM port and the physical connection between the instrument and the computer.
2. Template Path
The Template field defines the location of the software template or related configuration/report files.
Use the folder button next to this field to browse to the required directory if the template location needs to be changed. Normally it shows the installation folder of the software. For proper working of the software dont change default root of installation for the software.
3. Signal Filters
The Filter 1, Filter 2, and Filter F controls are used to enable or disable different filtering stages for the DSC signal.
The associated low cutoff values determine the cutoff setting of each filter.
These parameters influence signal smoothing and noise reduction. Excessive filtering may reduce the visibility of small or rapid thermal events, so the factory settings should normally be retained unless adjustment is necessary.
4. Rate Offset and Calibration Parameters
The left-side calibration section contains:
- Rate Offset: Correction value applied to the programmed or measured rate.
- Cal: Primary calibration correction value.
- Cal 2: Secondary calibration correction value.
- Delay (Sec): Time delay applied before switching the gas from N2 to O2 when temperature reaches the set value. This will be used when using machine in standard pressure OIT measurement. When the temperature reaches set value, a counter will start counting up and the counter reaches this value, machine will automatically switch from N2 to O2 gas.
5. PID Control Parameters
The software contains several PID parameter groups used for temperature-control performance.
Each PID group includes:
- Proportional Gain (Kc)
- Integral Time (Ti, min)
- Derivative Time (Td, min)
The separate PID groups allow different controller settings to be applied under different operating conditions or temperature regions.
Incorrect PID values may cause slow response, overshoot, oscillation, or unstable temperature control. These values could be changed only by the trained technician of the company in case of need.
6. Autotune
Click Autotune to allow the software to determine suitable PID parameters automatically for the current operating condition. This could be used only by repair technician of the machine.
7. Gain Change
The Gain change value defines the condition or threshold at which the software changes between PID control parameter sets.
8. OIT Tolerance Settings
The plus tol and minus tol fields define the permitted positive and negative temperature tolerance around the OIT test setpoint. This the settle range around set point to be neglected on the graphing of the data.
Note: Before turn off the machine don’t forget to click “Quit”. unless last settings of the valves and CPU will be remained.