
ISO 811 – Textile Fabrics – Determination of Resistance to Water Penetration – Hydrostatic pressure test / Testing Equipment
4 Apparatus
4.1 The apparatus used for the test should be designed to comply with the following conditions.
4.1.1 It should be possible to clamp the specimen of fabric in such a way that
a) it is horizontal and is not bulging;
b) an area of the fabric of 100 cm2 * is subjected to steadily increasing water pressure from below or from above the fabric;
C) no leakage of water takes place at the clamps during the test period (see annex, clause A.1);
d) the specimen does not slip in the clamps;
e) any tendency for penetration to occur at the clamped edge of the specimen is minimised (see annex, clause A.1).
4.1.2 The water in contact with the test specimen should be distilled or fully deionized water maintained at either 20 ± 2 °C or 27 ± 2 °C. The chosen alternative shall be stated in the test report. (The use of water at the higher temperature will yield lower values of hydrostatic head; the magnitude of this effect may vary from fabric to fabric.)
4.1.3 The rate of increase of water pressure shall be 10 ± 0,5 cm or 60 ± 3 cmH2O/min**. Results obtained by the two different rates may not be the same. The chosen alternative shall be stated in the test report.
4.1.4 A manometer connected to the testing head(s) should allow pressures to be read to an accuracy of 0,5 cmH2O (see annex, clause A.2).
6 Test specimens
After receipt, handle the fabric as little as possible, avoid folding it sharply and do not treat it in any way (e.g. by ironing it) other than by conditioning. Take at least five test specimens from different places in the fabric so that they represent the material as fully as possible. The fabric may be tested without
cutting specimens. Areas with deep creases or fold marks shall not be tested.
7 Test procedure
Provide freshly distilled water for each specimen tested (see annex, clause A.3).
Wipe all water from the clamping surfaces. Clamp the conditioned specimen in the test head so that the face of the fabric will be in contact with the water. The clamping shall be carried out in such a way that water will not be forced through the specimen prior to the start of the test. Subject the specimen immediately to increasing water pressure. Watch continuously for evidence of penetration by water.
Record the pressure, as conventional centimetres of water, at which water first appears at the third place in the specimen. The accuracy for recording the pressure shall be the following :
—until 1 mH2O : 0,5 cm
—more than 1 mH20 and until 2 mH2O : 1 cm
—more than 2 mH2O : 2 cm
Do not take into account very fine droplets which do not grow after being formed. Do not count subsequent drops which penetrate through the same place in the fabric. Note whether the penetration of water at the third place occurs at the edge of the clamp and reject as unsatisfactory any test in which such penetration occurs at a pressure less than the lowest pressure recorded for the other specimens from the same sample. Test further specimens until the requisite number of satisfactory results is obtained.
8 Calculation and expression of results
Calculate the mean of the pressures recorded for the specimens tested according to clause 7. Report the individual results and the mean result in conventional centimeters of water.
How to Work With the Machine
Air, Water, and Power Connections
1- Put the machine on a robust surface and adjust the legs
2- On the left side of the machine, you have the compressed air inlet line. you will need 6mm compressed air hose to be connected to this pressure regulator. Set the main pressure to less than 4 bar.
3- Connect the main power to a single-phase 220V-50Hz power socket. Don’t forget to connect the ground connection.
4- Connect the water hose in the back side of the machine to a tapped water line.
5- Connect the drain line of the machine to the water drain line of your laboratory.


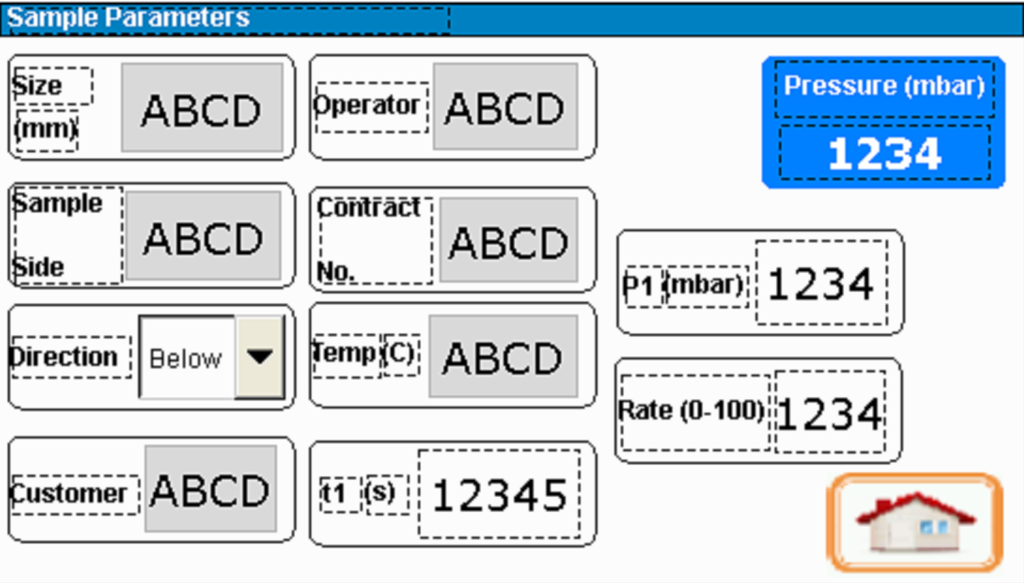
On the first page of sample parameters, you can input the parameters of the sample you are going to start testing. This information will be printed on the paper when you are printing the report, and also will be saved on the EXCEL file, when you are exporting the data to MS Excel from the data port to a flash disk.
On this page, there are 3 parameters directly controlling the test:
t1(s): It is in terms of the second and it the time that the pressure will be applied
p1(mbar): It is the pressure level that will be applied to the sample piece
Rate (0-100): It is the rate of pressure application to the sample piece
After you set the control parameters (t, p and rate of pressure increase) on the first page, you can come to testing page.
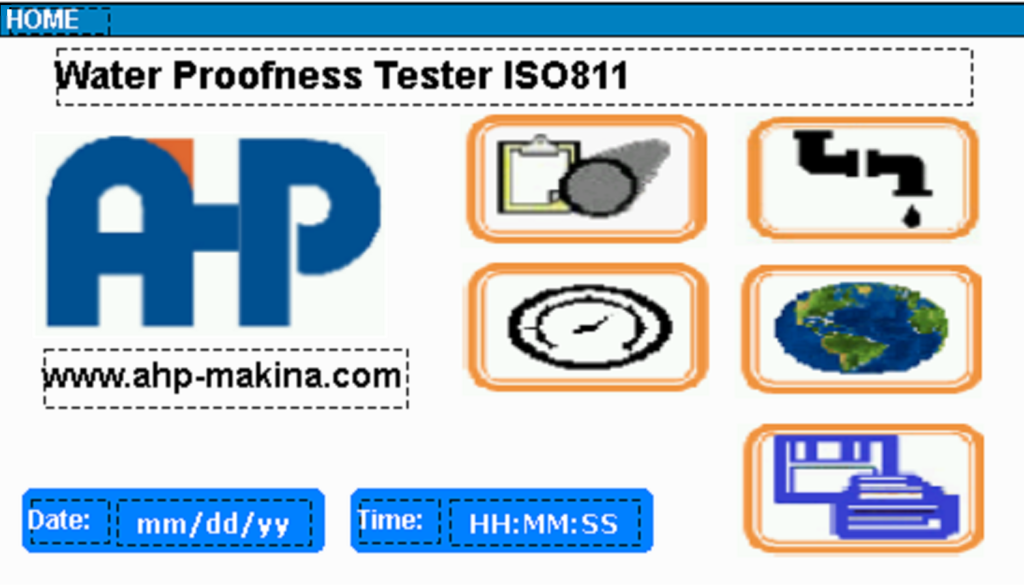
Before starting the test, you need to click on Drain Off. This key is on the HMI screen on the above page.
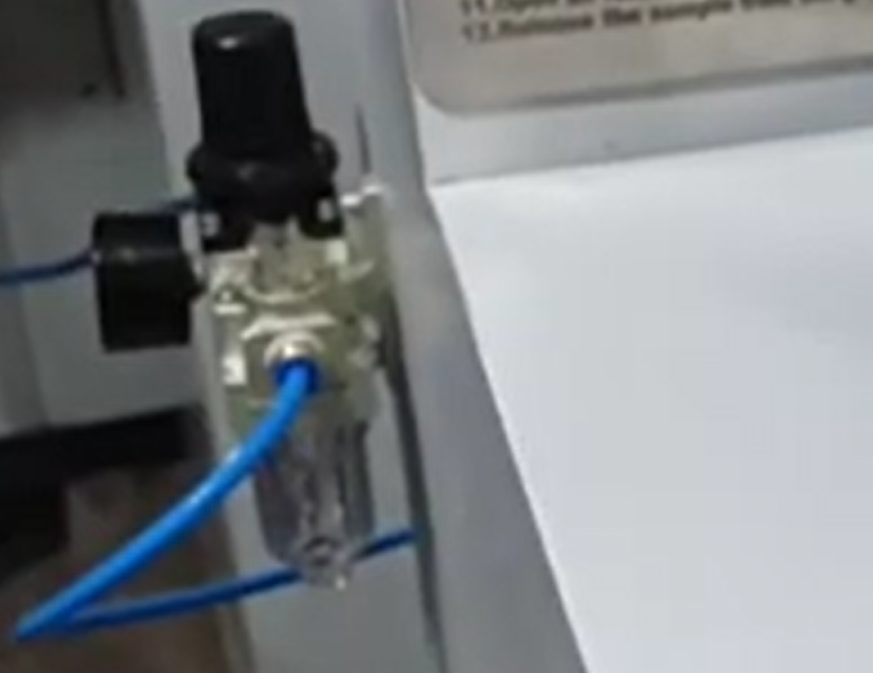
Then you need to open the “Air Relief Valve” on the right side of the front panel (as depicted in below picture).

Open the “Water Fill Valve” on the left side of the front panel of the machine until the sample holder (below picture) is full of water without air bubbles. Then close the manual filling valve.
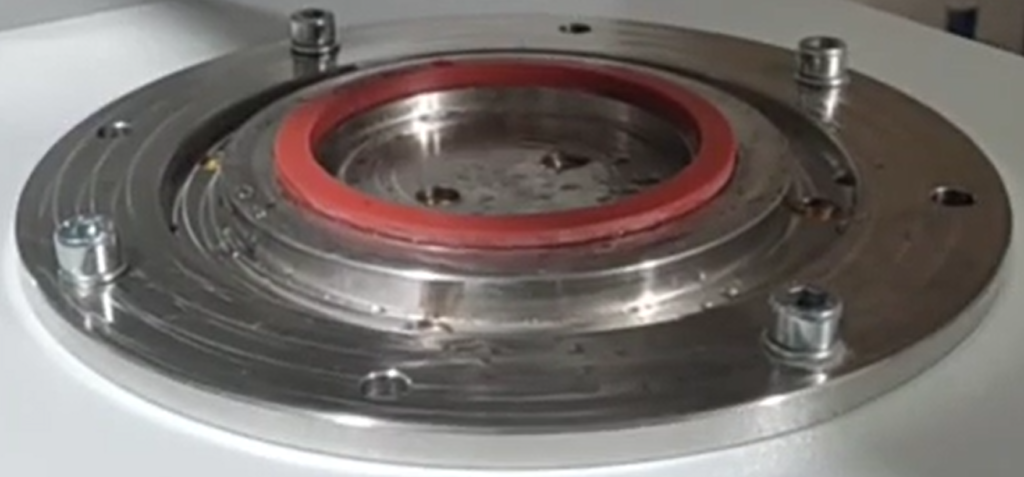
The water will be filled on the center circle of the sample holding place as below picture.

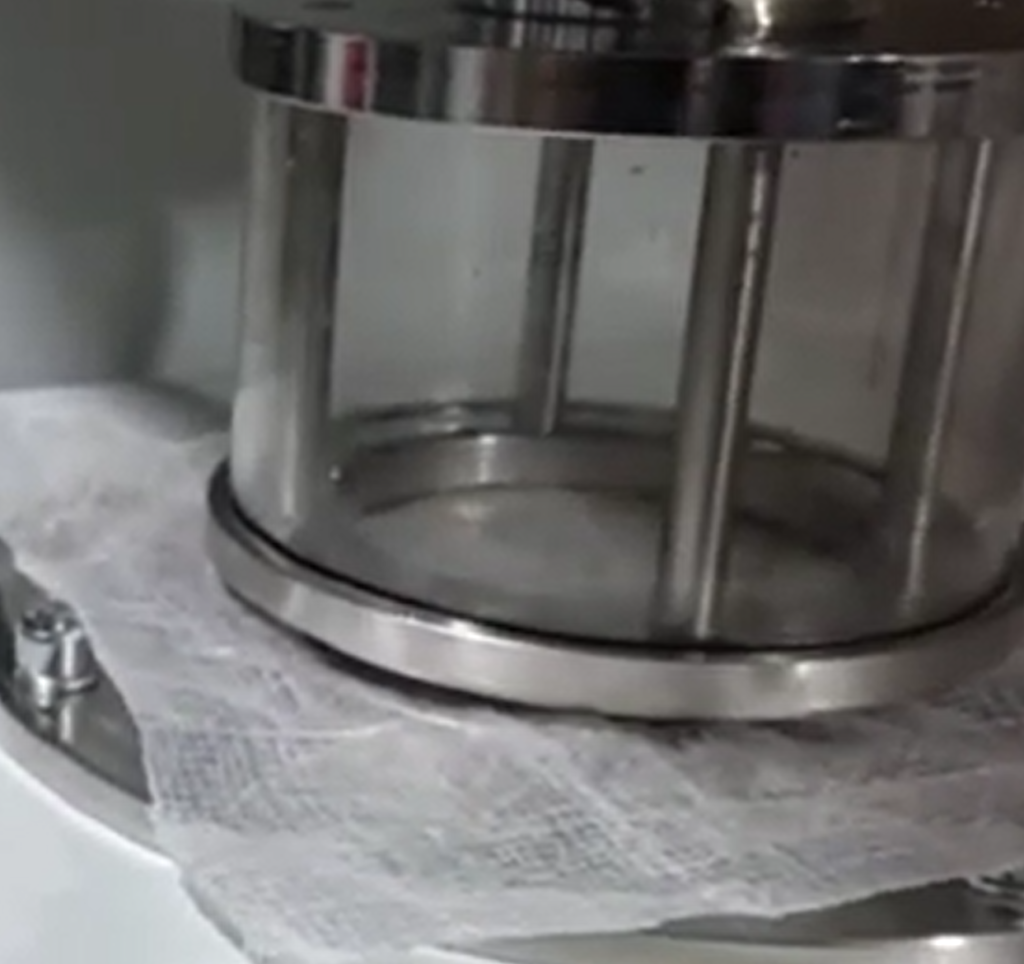
Place the sample on the seal ring of sample holder.

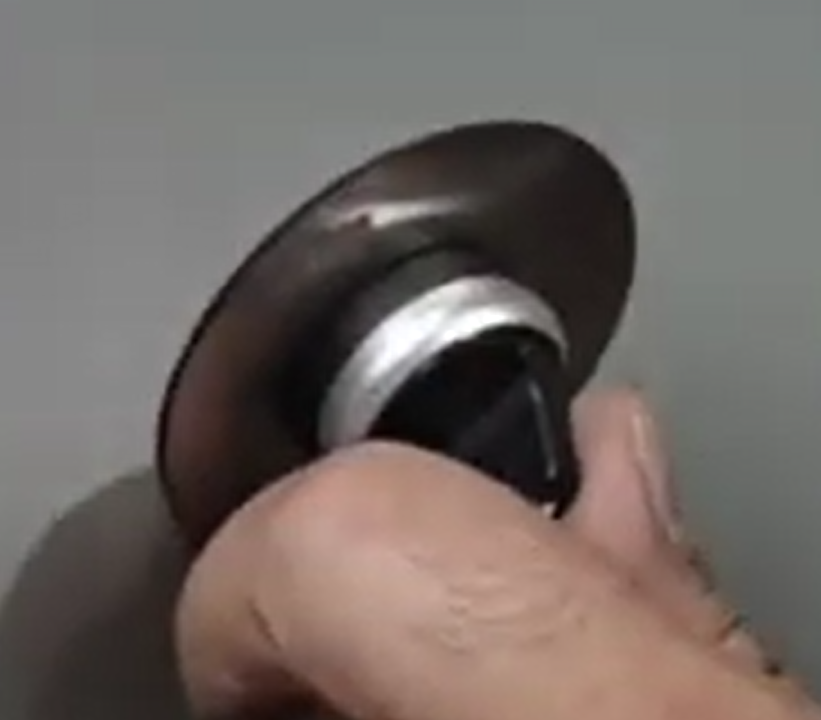
Using the key of the gripper, close the sample grip. Avoid folding the sample sharply and do not treat it in any way (e.g. by ironing it) other than by conditioning.
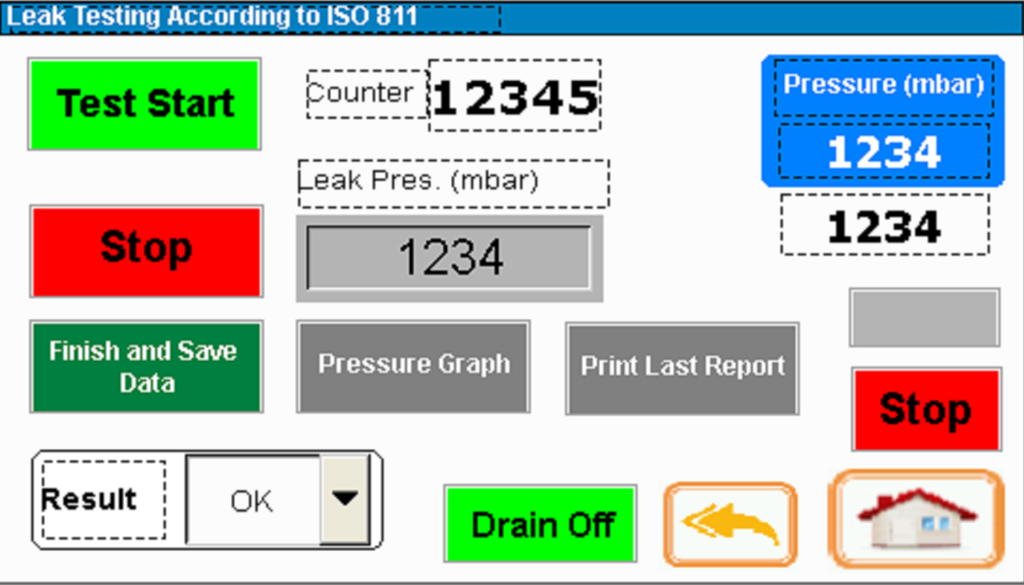
On this page, click on the Drain off key, and now you are ready to start the test. Just click on “Test Start” on this page, and the pressure will start increasing with the “Rate” that you set on the sample parameters.
When the time reaches the time that you set for sample parameters, the test will be stopped automatically, or when you see any water droplets on the sample surface, you need to click on “STOP”. When you click on “STOP”, There pressure of the leak will be saved automatically on “Leak Pres(mbar)”.
After you stop the test, you can click on “Print Last Report” to print the current test results. Or during the test, you can also see the graph on the page of “Pressure graph”.
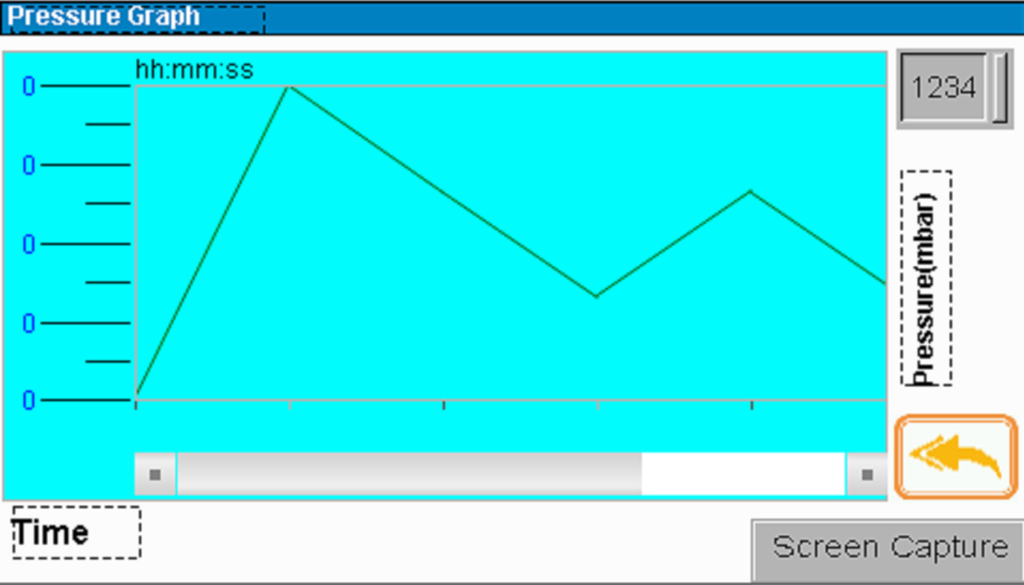
On this page, you can see the pressure graph and take a screenshot of the graph, and save it to the flash disk.

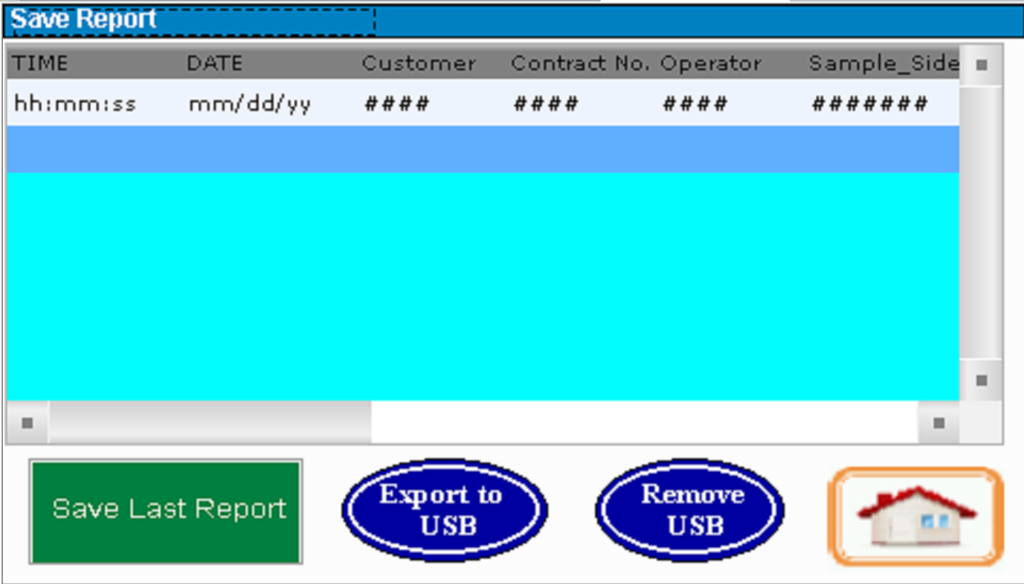
For saving data to the flash disk as MS ESCEL file, just put the flash in the data port on front panel of the machine. After testing is done, come to this page, Clock on “Save Last Report” and then “Export to USB”. The data will be saved on the flash disk as EXCEL file.
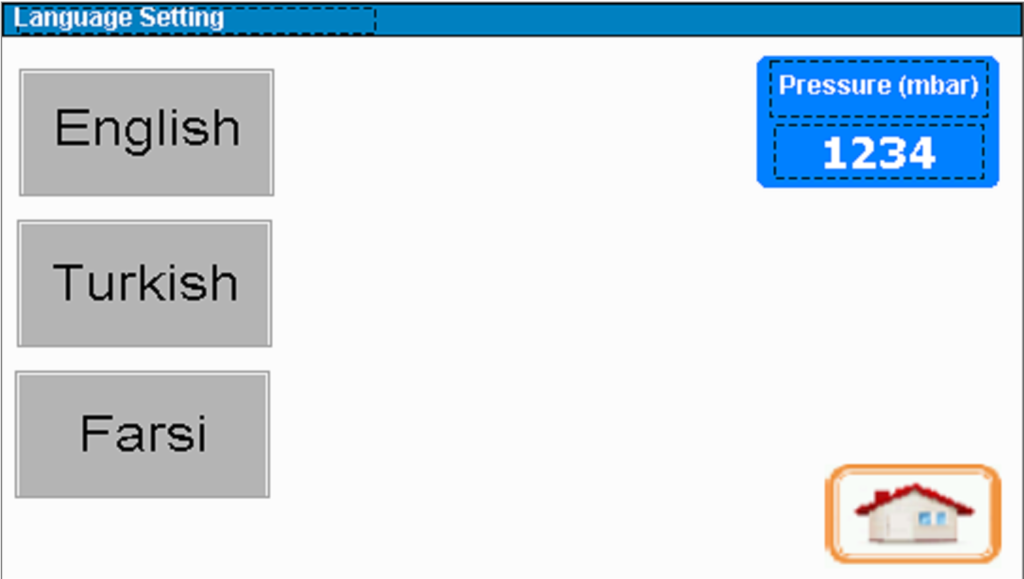
On this page, you can set the language of the HMI display. So far, we have 3 languages as depicted in the above picture.