
4 Apparatus
4.1 DSC instrument, and associated software, calibrated.
Calibration should be carried out using at least two different metals. An instrumental baseline must be obtained with an empty sample pan and reference pan in place, and with temperature settings and purge gas identical to the settings to be used for the sample analysis.
4.2 Aluminium sample pans.
4.3 Inert purge gas (e.g. N2, Ar, etc.), of at least industrial quality.
4.4 Analytical balance, with an accuracy to within .
4.5 Slow-speed saw (see Reference [3]), knife, or any other device introducing neither heat nor stress into
the sample as it is cut.
5 Preparation of the test pieces and the test
5.1 Take at least four samples at the 0, 90, 180 , and 270 degrees positions, respectively, around the pipe
circumference, with all the samples being taken from the centre of the pipe wall.
NOTE The samples are taken from the centre of the pipe wall because the processing temperature at the centre of the pipe wall is often lower than that close to the inner and outer surfaces, where additional shear occurs.
CAUTION — Taking samples from the locus of a spider line can lead to an increase in the spread of
results.
5.2 Prepare the test pieces having a mass of (20 ± 10) mg in a way that maximizes the contact surface
between the pan and the test piece.
NOTE Maximizing the contact surface between the pan and the test piece reduces the resistance to heat flow through the DSC temperature sensors and results in maximum peak sharpness and resolution.
5.3 The best test piece shapes for optimum performance are thin disks placed on the bottom of the pan. Test pieces may be conveniently prepared by cutting out sections with a slow-speed saw or with a razor or knife (4.5). A hole punch or cork borer may be used if the sample is very thin.
6 Procedure
6.1 Ensure that the scanning device is calibrated.
6.2 Encapsulate the test piece in an aluminium pan with cover.
6.3 It is important that the test piece does not move in the pan during the measurement. The most common method to immobilize the test piece is to crimp the pan cover in place with a crimper. This yields a tightly, but not hermetically, sealed pan without movement of the test piece in the pan during the measurement. Other methods of pan closure that immobilize the test piece may be used.
6.4 Using the following test parameters, perform and register the scan:
a) start temperature: (35 ± 15) ◦C
b) end temperature: 225 ◦C
c) heating rate: (20 ± 1) ◦C/min
d) purge gas (4.3): (20 ± 5) ◦C/min
7 Expression of results
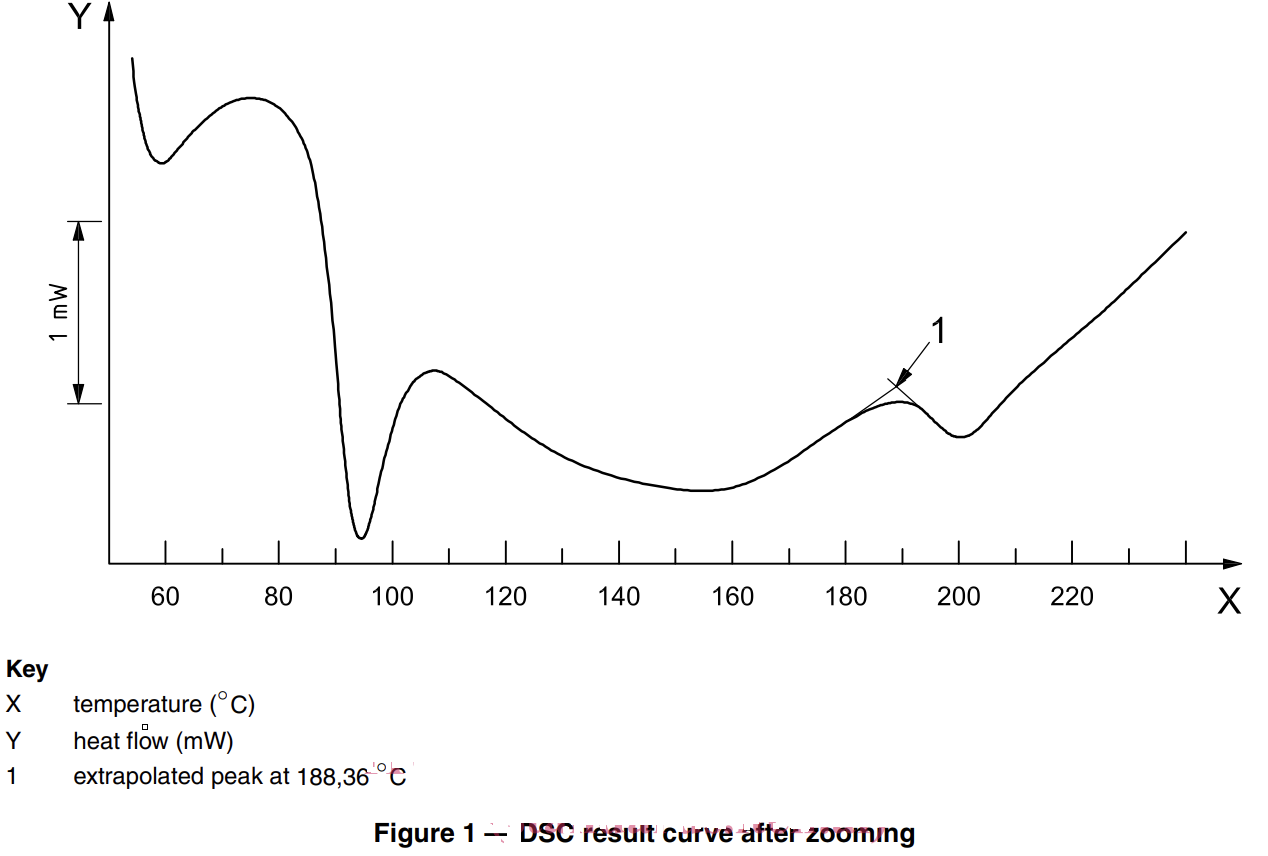
If necessary, magnify the relevant part of the curve using the zooming feature of the DSC instrument. Determine the B-onset by taking tangents to the DSC curve at the points of maximum slope just before and just after this point of inflection in the curve, as shown in Figure 1.
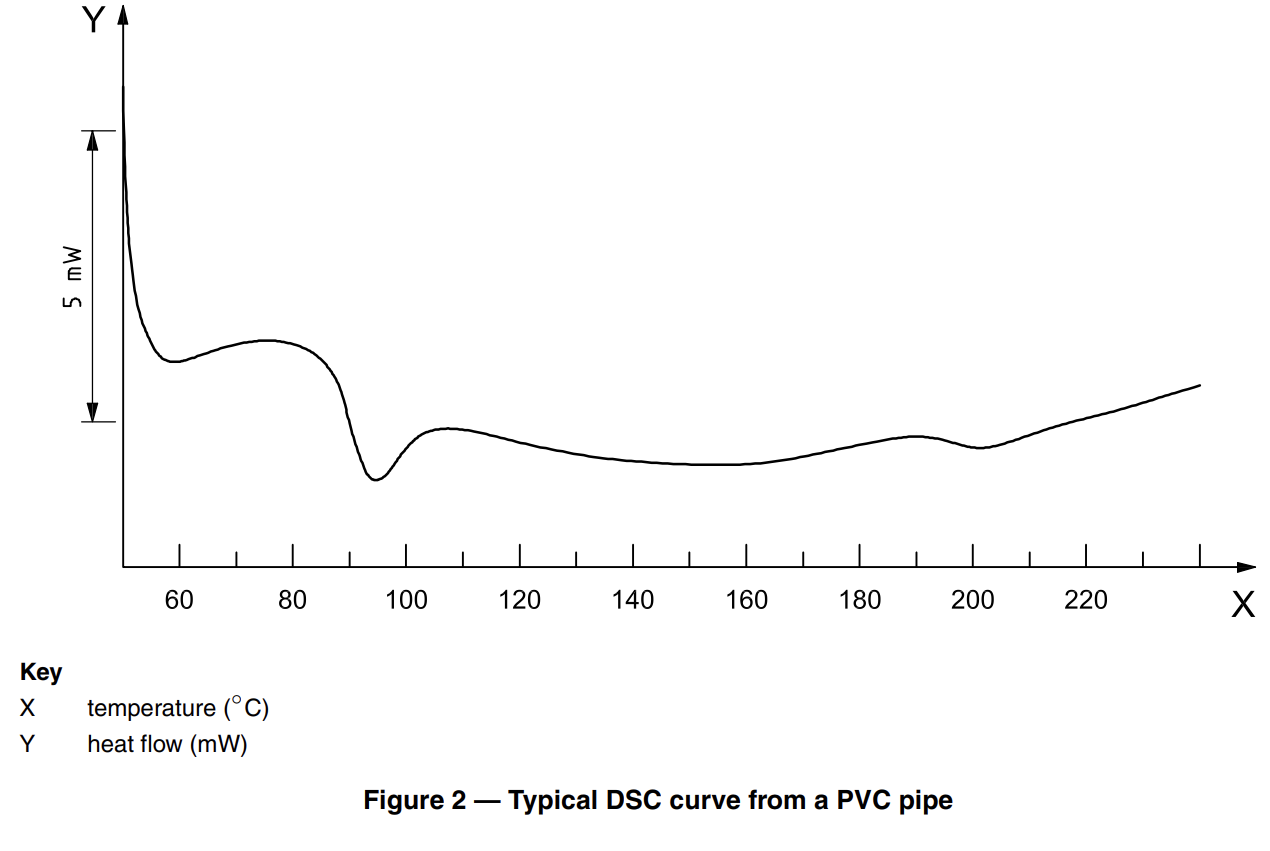
NOTE 1 A typical curve consists of two endotherms between approximately 100C and approximately 200C where the B-onset corresponds very closely to the maximum processing temperature,Tp . The change in energy levels is usually quite small. See Figure 2 for an example.
If the individual results from three consecutive tests on samples taken from the same location (i.e. the same angular location) within a pipe differ by more than , 3C then further tests shall be made and/or the instrument re-calibrated.
NOTE 2 If the glass transition values, Tg (typically at 70C to 80C), do not vary by this amount, then the differences reflect real differences in the sample.
Uneven or irregular scan data shall be discarded.
Possible sources of error are given in Annex C.
The correlation between B-onset temperature and time to stress rupture is given in Annex D.
NOTE 3 The appearance of DSC curves can differ depending upon whether the curve is displayed as “exo up” (see Figures 1 and 2) or “exo down”. The latter type produce “inverted” curves compared with Figures 1 and 2. Examples of the different types of presentation are shown in Annex A.
NOTE 4 The presence of some additives can also be detected by DSC and so extra peaks can appear in the DSC curves as a result. Examples of these are shown in Annex B.
8 Test report
The test report shall contain the following information:
a) reference to this part of ISO 18373;
b) sample reference number (e.g. production code number of the pipe);
c) location from where the samples were taken (e.g. 0, 90, 180, 270 degrees around the circumference of the pipe);
d) mean and standard deviation of B-onset temperature;
e) number of repeat samples tested;
f) minimum value of B-onset measured in any single scan;
g) any factors that could have affected the results, such as any incidents, test interruptions or any operating details not specified in this standard;
h) date(s) of test.
Check our YouTube channel for videos of the products, ask any questions on WhatsApp: